Upon completion of this article, you will be able to:
- Describe the basic process of LTE network tuning.
- Understand the different steps in the process of LTE network tuning.
- Understand the coverage problem analysis and handover problem analysis during LTE network tuning.
1. Basic Process of LTE Network Optimization.
The main target of network tuning is to ensure coverage, control interference, and resolve basic handover problems.
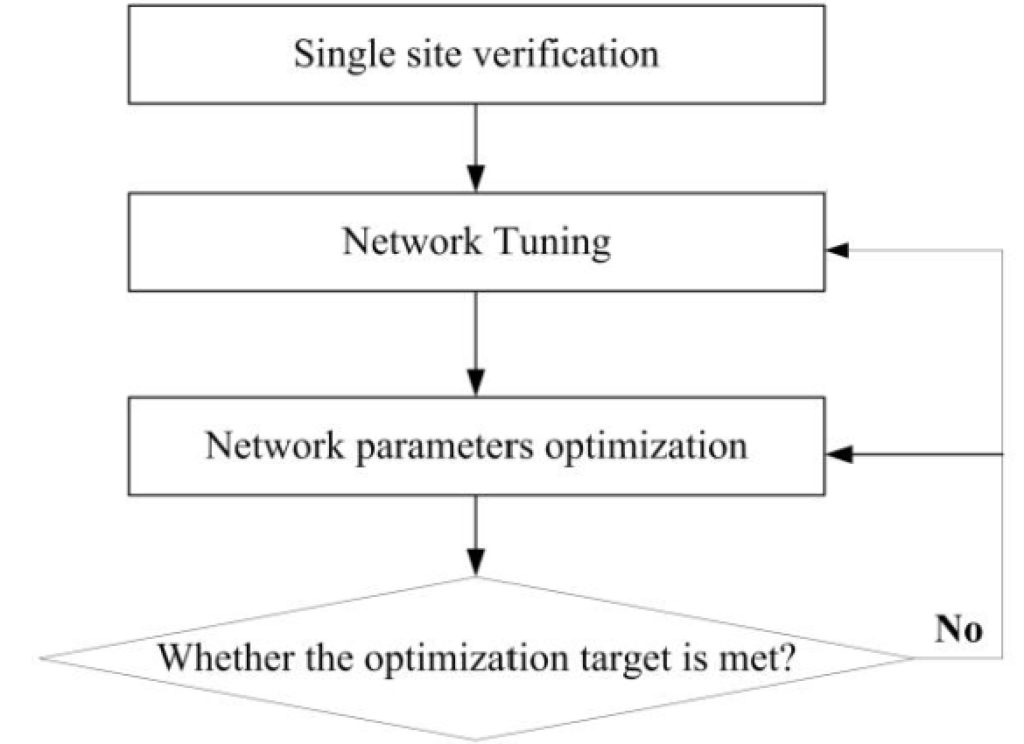
Single Site Verification:
- Single site verification ensures that every single site can work normally.
Network Tuning:
- The main target of network tuning is to ensure coverage, control interference, and resolve basic handover problems. Network tuning is typically based on drive tests.
Network Parameters Optimization:
- In the network parameter optimization step, the main target is to ensure KPI performance through field tests and KPI statistics analysis.
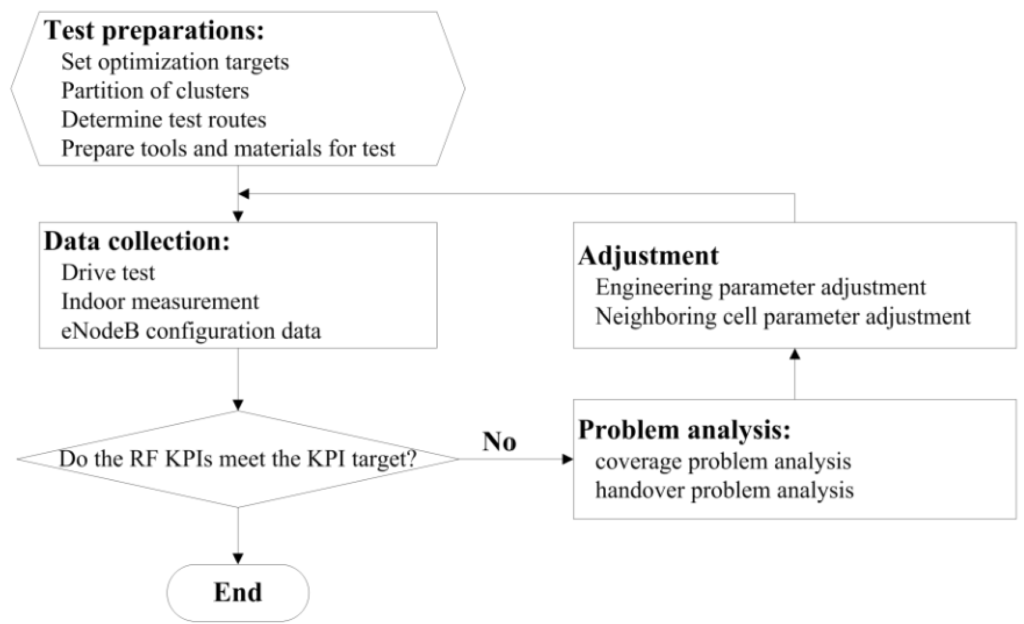
2. Test Preparations for LTE Network Tunning.
Set Optimization Target.
Coverage is the most import requirement of network tuning. The following is a example of coverage target:
| Acceptance Content | Reference Value | Remarks |
| RSRP ≥ -110 dBm | ≥ 95% (urban area) | This is the result of a scanner test conducted without outdoor load in the planned coverage areas. The test routes are of grid structure, covering all cells. |
| As above | ≥ 90% (suburb) | As Above |
| SINR ≥ 5 dB | ≥ 95% | This is the result of a UE test conducted without outdoor load in the planned coverage areas. The test routes are of grid structure, covering all cells. |
RSRP & SINR.
- RSRP (Reference Signal Received Power):
- RSRP is defined as the linear average over the power contributions of the resource elements that carry cell-specific reference signals within the considered measurement frequency bandwidth.
- SINR (Signal-to-Interference plus Noise Ratio) = S / (I + N):
- Signal (S): Power of the effective signal.
- Interference (I): Power of interference.
- Noise (N): Thermal noise of the receiver.
Some Other KPI for Drive Test.
Other KPIs for Drive Test:
For some network tuning projects, additional KPIs beyond coverage KPIs may be needed. Examples include:
- LTE/SAE Attach success rate.
- E-RAB setup success rate.
- Call drop rate.
- Intra-LTE handover success rate.
- Intra-LTE handover delay.
- FTP download average throughput.
- FTP upload average throughput.
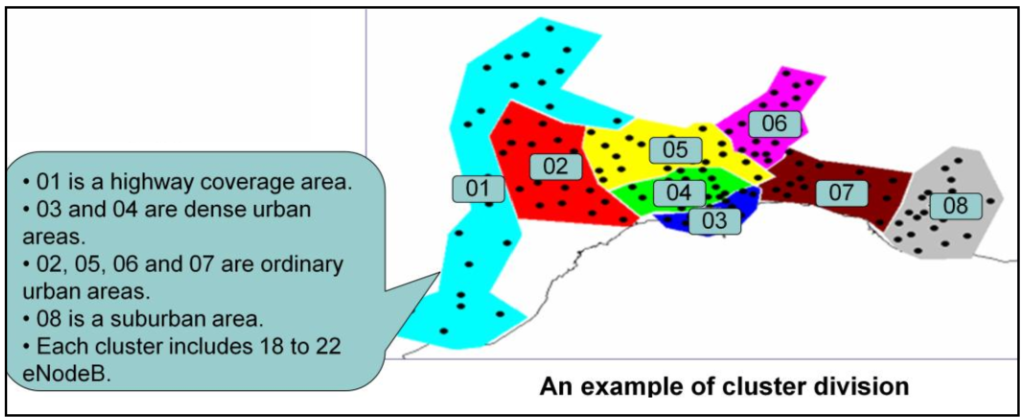
Partition of Cluster.
Network tuning is performed in a group/cluster of eNodeBs, rather than for each single eNodeB separately. Some considerations for cluster division include:
- Terrain
- Traffic
- Route line.
Determine Test Routes.
Some considerations for the test route plan:
- Cover main streets and important places.
- Cover all cells if possible.
- Cover the borders of neighboring clusters.

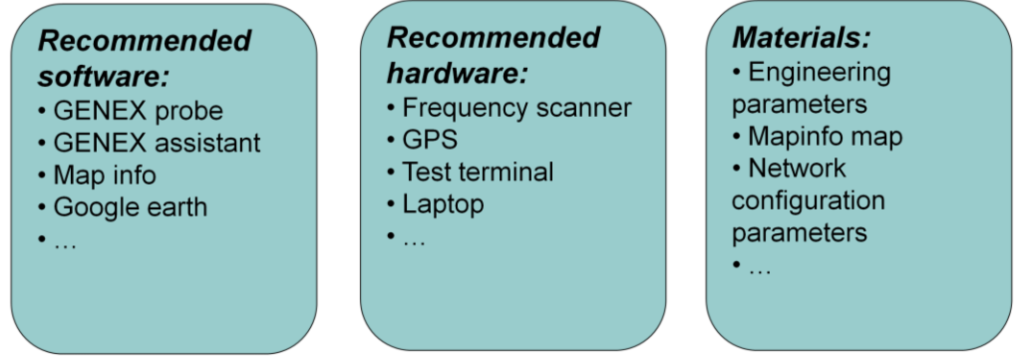
Preparing Tools and Materials.
Data Collection for L TE Network Tuning.
Data Collection:
Before Network Tuning:
- Collect planned neighboring cell data and the data configured in eNodeB.
- Check the consistency between the current configured data and the planned data.
Drive Test Result:
- Save the results of outdoor/indoor drive tests for analysis.
Coverage Problem Analysis.
Analyzing coverage problems is a crucial aspect of RF optimization, which focuses on signal distribution.
- Some common coverage issues are:
- Weak coverage
- Cross coverage
- Lack of a dominant cell.
Weak coverage:
- Weak coverage occurs when the RSRP of the reference signal in a coverage area is smaller than a threshold (typically around -110 dBm).
- If the RSRP of the pilot signal is very low, the UE may not be able to camp in the cell or may not be able to trigger registration.
- Weak coverage can also degrade the Quality of Service (QoS) of services and cause occasional call drops.
Cross coverage:
- Cross coverage happens when the coverage area of an eNodeB extends beyond its planned scope, creating discontinuous dominant areas within the coverage of other eNodeBs.
- Cross coverage can create isolated “islands”. Calls connected to these distant islands, which are still served by the eNodeB but are not adjacent to other cells, may experience immediate call drops when the UE leaves the island area. Even if neighboring cells are configured, call drops may occur due to untimely handovers because of the small size of the island area.
Lack of dominant cell:
- Lack of a dominant cell refers to an area where there is no clear dominant cell or where the dominant cell frequently changes.
- Frequent handovers due to a lack of a dominant cell reduce system efficiency and increase the likelihood of call drops.
Factors Affecting Coverage.
For Downlink:
- Downlink Tx power
- Path loss in downlink
- Carrier frequency
- Distance between UE receiver and eNodeB transmitter
- Propagation environment
- Antenna gain
- Height of antenna
- Tilt of antenna
- Azimuth of antenna
For Uplink:
- Uplink Tx power
- Path loss in uplink
- Carrier frequency
- Distance between UE transmitter and eNodeB receiver
- Propagation environment
- Gain of Rx diversity in eNodeB.
Solutions for Weak Coverage.
- Optimize coverage by adjusting the azimuth and tilt of the antenna, increasing the height of the antenna, and using an antenna with higher gain. The preferential measure is electrical tilt, followed by mechanical adjustment tilt, and then
adjustment of azimuth. - For the non-overlapped parts of the coverage areas of two adjacent eNodeBs, if they have plenty of users or are large in size, a new eNodeB should be built or the coverage of adjacent eNodeBs should be enlarged, so as to deepen the overlaps of
the coverage of the two eNodeBs. Meanwhile, attention should be paid to intra-frequency interference as a possible result of increase of coverage scope. - For a weak coverage area caused by a hollow and back of a hill, the coverage scope can be extended with a new eNodeB or RRU.
- For a dead zone inside an elevator shaft, tunnel, underground garage or basement, and high building, the measures include use of RRU, indoor distribution systems, leakage cables, and directional antennas.
Solutions for Cross Coverage.
- For cross coverage, try to prevent an antenna from transmitting signal right towards a road, or use the adjacent buildings to produce a blocking effect to decrease cross coverage.
- For a high eNodeB, changing its address is an effective method. Generally, however, it is always very difficult to find a suitable substitute for new site. So adjusting the pilot power or using an electrical tilt antenna to reduce the eNodeB coverage scope is a
possible solution.
Solutions for Lack of Dominant Cell.
For an area without a dominant cell, a typical method is to strengthen the coverage of a cell with strong signal (or a short distance cell) and weaken the coverage of other cells with weak signal (or long-distance cells) by adjusting the antenna tilt and azimuth.
Coverage Analysis Process.
Normally coverage analysis process includes downlink coverage analysis and uplink coverage analysis.
Downlink coverage analysis: RSRP.
Uplink coverage analysis: UE Tx Power.
RSRP for Downlink Coverage Analysis.
- Downlink coverage analysis is to analyze the RSRP.
- The RSRP quality standard must be combined with the optimization standard. The following is a example of the optimization standard of RS RSRP:
| RSRP ≥ -110 dBm | ≥ 95 % | Result of test by using scanner. with the UE antenna placed outdoor. |
Good: RSRP ≥ -90 dBm
Fair: -110 dBm ≤ RSRP < -90 dBm
Poor: RSRP < -110 dBm.
Basic Process of Downlink Coverage Analysis:
RS Coverage Strength Analysis:
- Check the RSRP (Reference Signal Received Power) distribution and identify weak coverage areas.
Dominant Cell Analysis:
- Analyze PCI (Physical Cell Identifier) information to identify areas where the best PCI changes frequently. This helps in understanding and managing the dominant cell in the network.
An Example of RS Coverage Strength Analysis.

The figure shows the RSRP distribution of the best cell.
An Example of Dominant Cell Analysis.
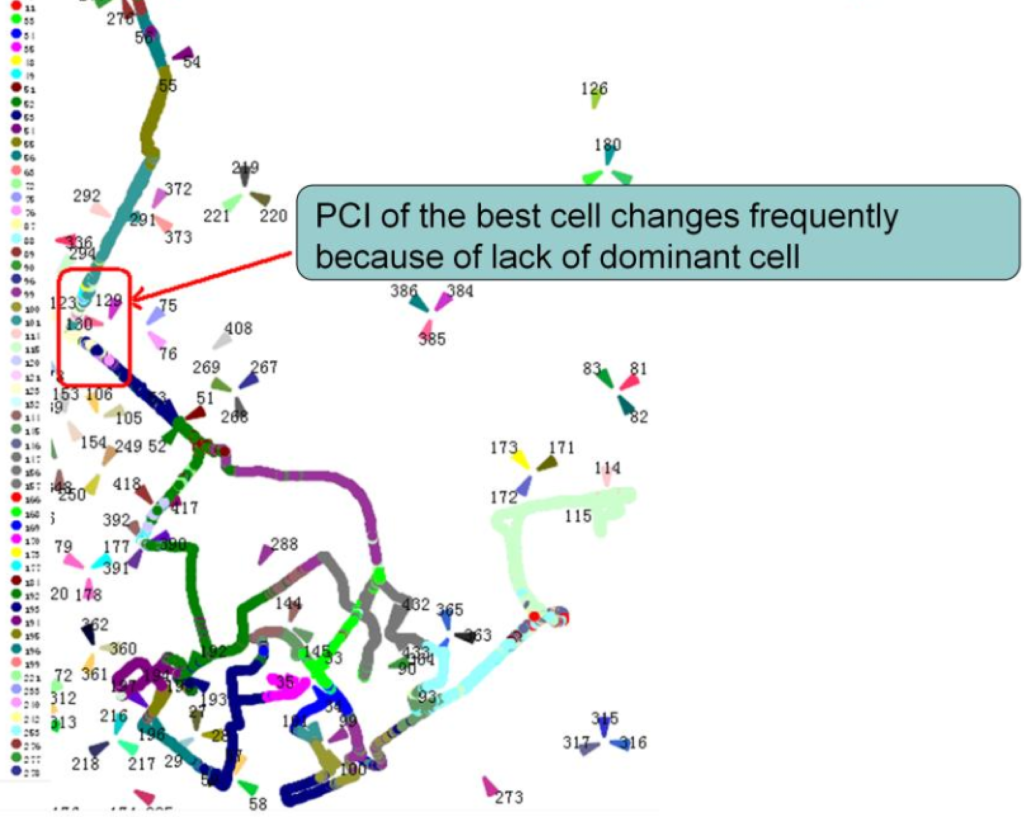
The figure above shows the distribution of PCI for the best cell.
UE Tx Power for Uplink Coverage Analysis:
The main method of uplink coverage analysis is to analyze the distribution of UE transmission power.
UE Transmission Power:
- UE transmission power reflects the uplink path loss and uplink interference.
- The distribution of UE transmission power reflects the distribution of uplink interference and uplink path loss.
By analyzing the distribution of UE transmission power, network engineers can assess the uplink coverage performance, identify areas with high interference or path loss, and optimize the network accordingly.
An Example of UE Tx Power Distribution.
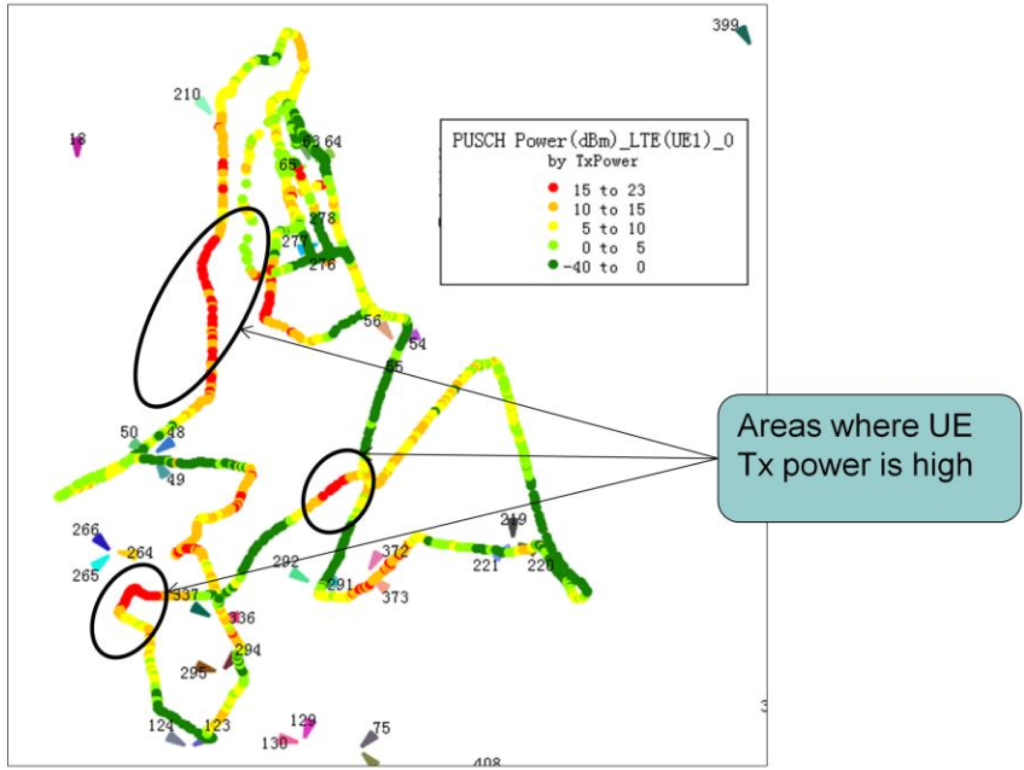
It can be seen from the figure in the slide that the UE transmission power is lower than 10
dBm in normal situations, and will rise dramatically over 10 dBm only when there is an
uplink interference or coverage area edge. In comparison, a macro cell is more likely to
subject to uplink coverage restriction than a micro cell.
Case 1 (Cross Coverage): Symptom.
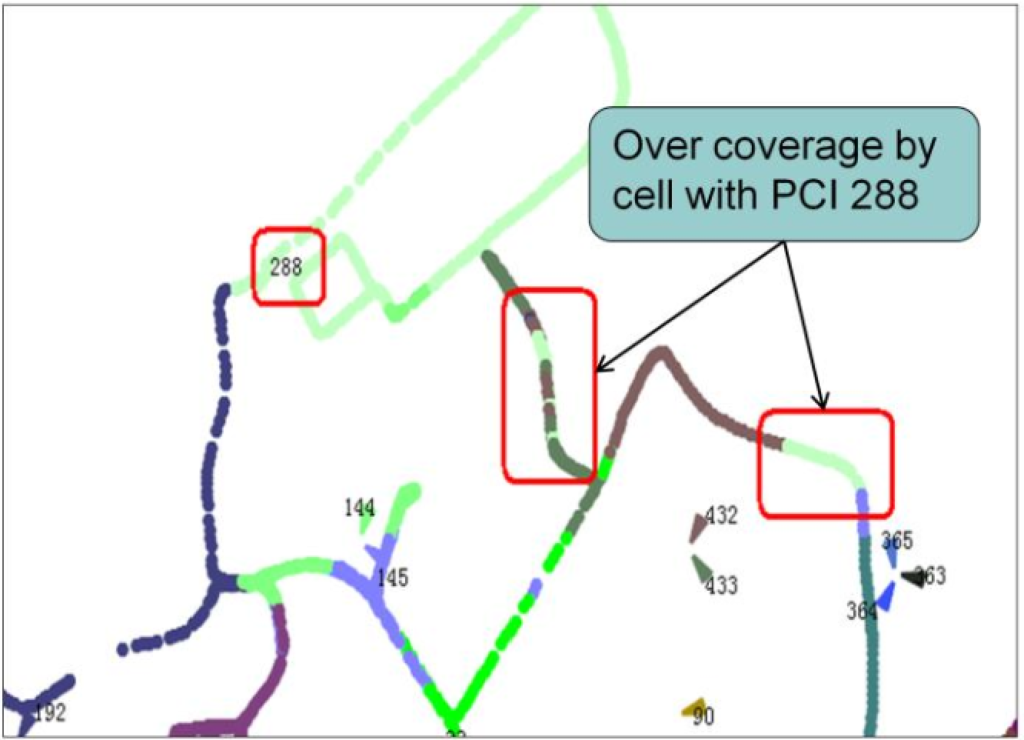
As shown in the figure, over coverage is caused by the cell with PCI 288.
- Over Coverage Issues:
- Over coverage can interfere with other cells and increase the probability of call drops.
- Possible Reasons for Over Coverage:
- The most likely reason for this over coverage is either an excessive height of the antenna or improper setting of the antenna tilt.
- Recommended Solution:
- A check of the current engineering parameter settings shows that the tilt is too small.
- It is recommended to increase the tilt of the antenna to mitigate the over coverage issue.
Case 1 (Cross Coverage): Adjustment.
Adjust the tilt of cell with PCI 288 from 3 degree to 6 degree. The result after adjustment.

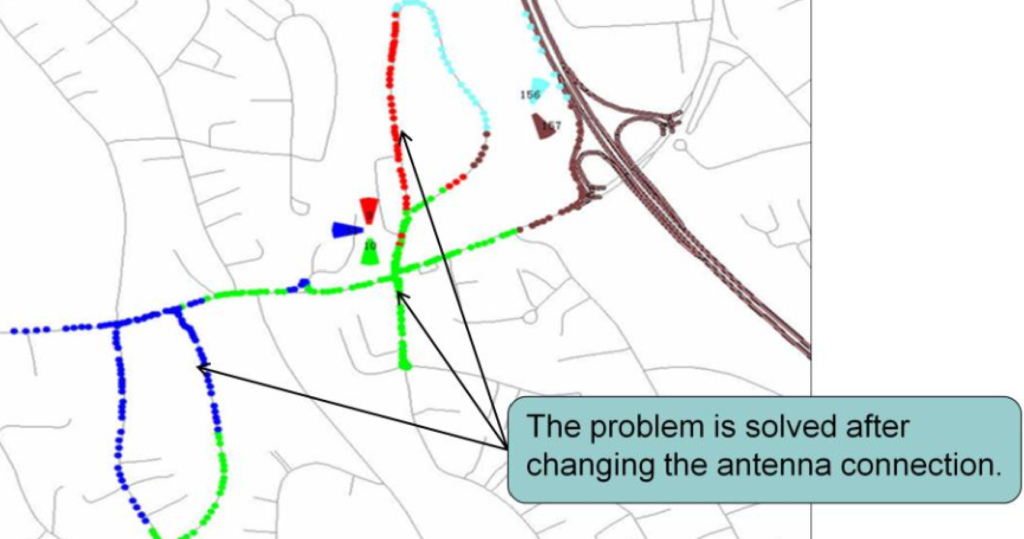
Case 2 (Wrong Connection of Antenna): Symptoms.
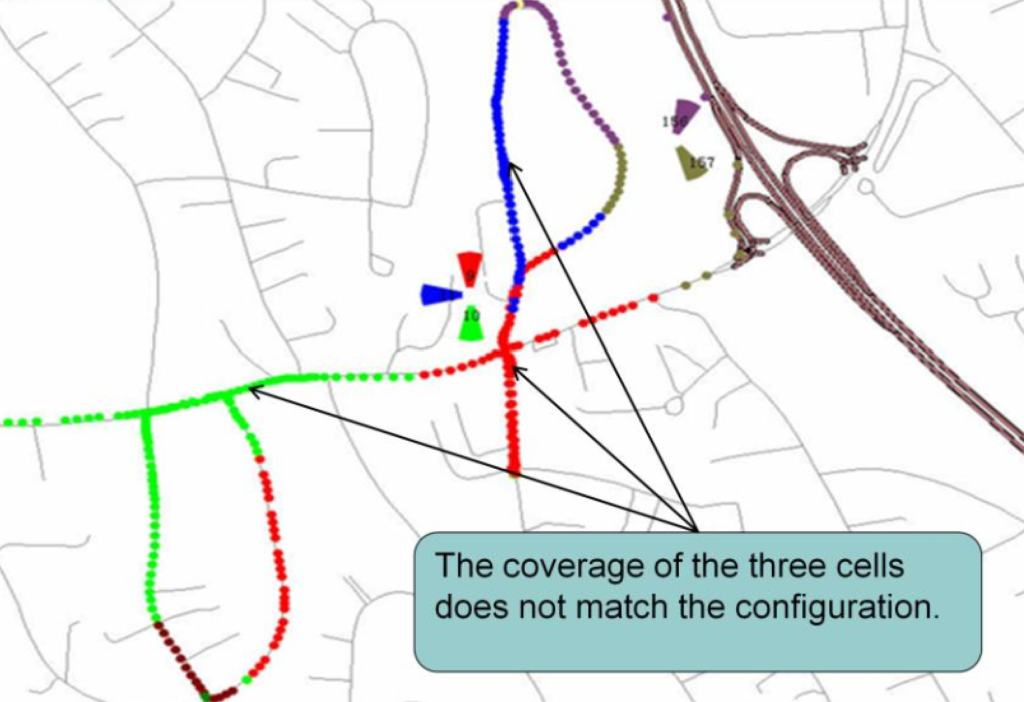
Case 2: Analysis & Adjustment.
In this case, the antenna connection for the three cells is wrong. The antenna for cell 9 is connected to cell 10. The antenna for cell 10 is connected to cell 11. The antenna for cell 11 is connected to cell 9.
5. Handover Problem Analysis.
Main Handover Problems During Network Tuning:
During network tuning, two main problems can affect handover:
- Channel Quality Problem:
- Issues related to the quality of the channel, such as poor signal strength or interference, can lead to handover failures or degraded performance.
- Neighboring Relation Problem:
- Problems with neighboring cell relations, such as incorrect configuration or missing neighbor relations, can cause handover failures or unnecessary handovers between cells.
Addressing these problems during network tuning is crucial to ensure smooth handovers and optimal performance of the LTE network.
Channel Quality Problem.
- Under multi-user or loading test scenario, the interference is more serious; poor channel quality leads to signaling lost and handover failure.
- Channel quality can be divided into UL and DL for analysis.

Indeed, uplink and downlink in LTE networks are interdependent, and poor downlink channel quality can affect various aspects of network performance beyond just downlink signaling. For instance:
- Impact on Uplink Signaling:
- Incorrect PDCCH (Physical Downlink Control Channel) demodulation can lead to issues in scheduling uplink signaling.
- This can result in uplink signaling being lost or not being properly scheduled, impacting the overall network performance.
Therefore, when analyzing network issues, such as lost uplink signaling, it’s important to consider the possibility that poor downlink channel quality or incorrect demodulation of downlink signaling could be contributing factors. This requires a holistic approach to troubleshooting and optimizing LTE networks, addressing both uplink and downlink performance comprehensively.
Typical Parameters for Channel Quality.
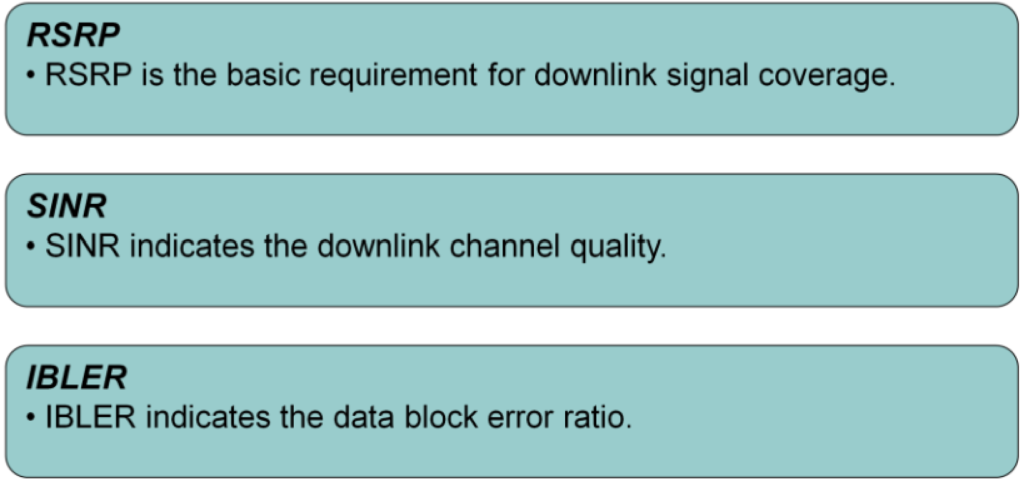
All the parameters can shown in GENEX Probe which is HUAWEI drive test software. IBLER is initial BLER.
Neighboring Relation Problem.
During network tuning the basic problem of neighboring relation is missing neighboring cells.
- Because of configuration mistakes maybe some neighboring cells are missed. It can result in call drop.
- ANR (automatic neighbor relation) can help to solve this problem, but ANR is not fully verified in commercial networks.
Case-1 (Missing Neighboring cells): Symptom
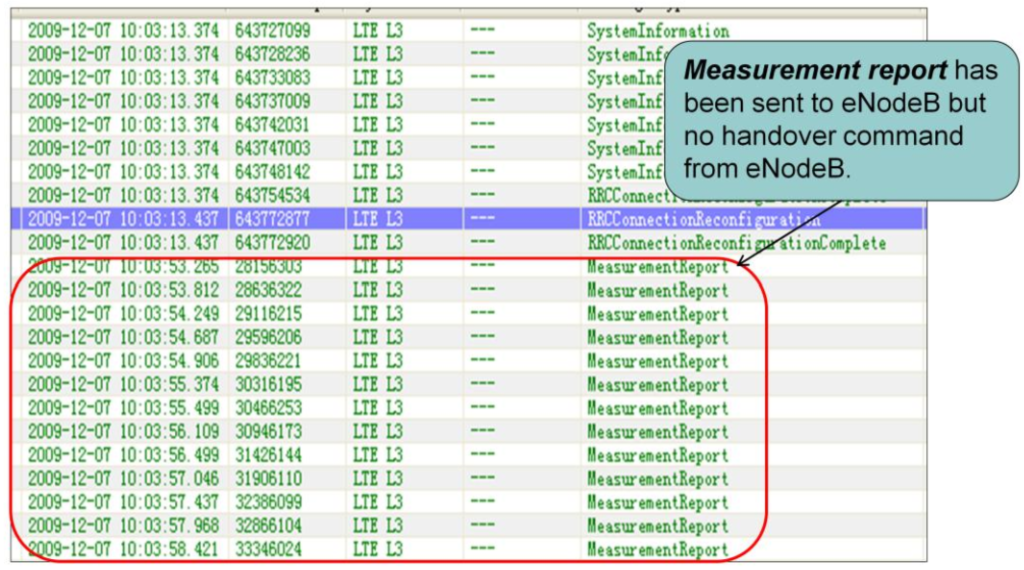
This scenario suggests a problem with the handover process where the eNodeB did not initiate the handover despite receiving the necessary measurement reports from the UE. Such issues can lead to call drops due to the UE remaining connected to a deteriorating or unsuitable cell. Resolving these issues typically involves analyzing the handover configuration, ensuring proper neighbor relations, and adjusting handover parameters to improve handover decision-making.
Missing Neighboring cells Analysis.
- UE sent measurement report to eNodeB. But eNodeB didn’t send handover command. Missing neighboring cell is a possible reason.
- To confirm that the problem is caused by missing neighboring cell:
- At first, check measurement report to find which cell are reported.
- Next step is to check whether the reported cell is included in RRC connection reconfiguration (measurement control).
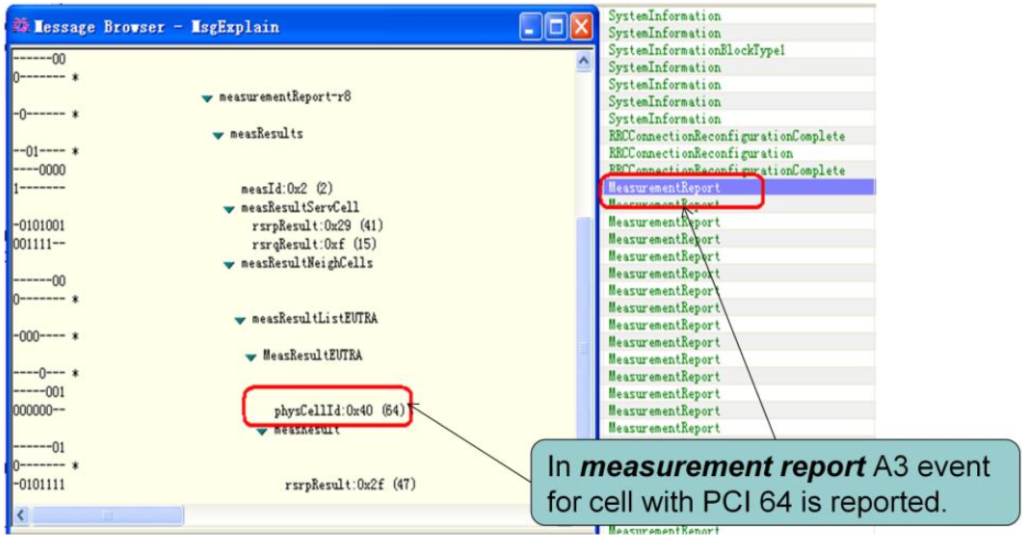
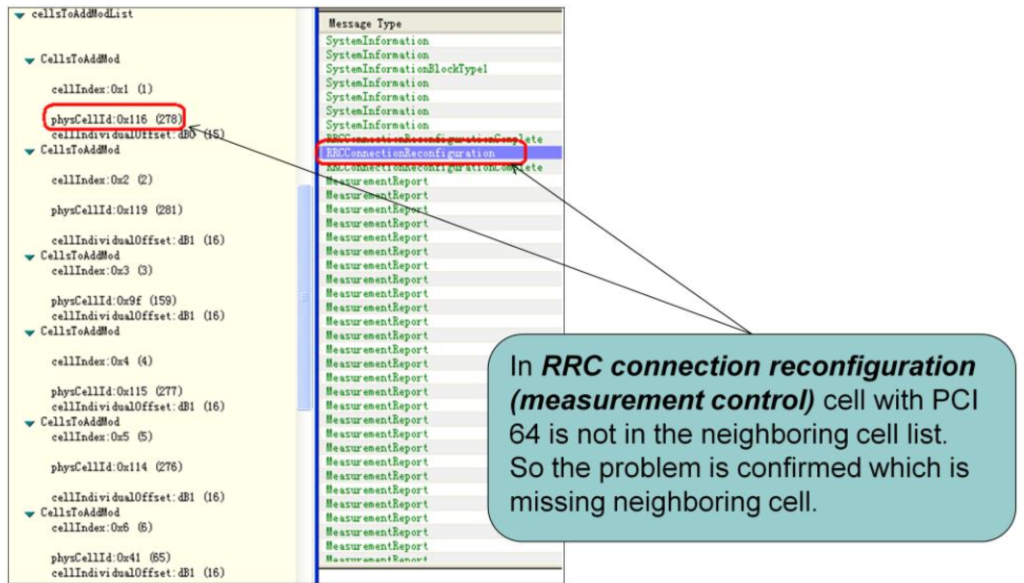
To confirm the problem, we can also check the neighboring cell configuration in eNodeB.
Case-2 (Interference): Symptom.
During the test, the handover from cell with PCI 281 to cell with PCI 279 fails.

Interference Analysis.
In this case, the interference from the cell with PCI 178 is too strong. So the UE can not receive the handover command correctly, then handover failed.

Interference Adjustment.
In this case, to control the interference from the cell with PCI 178, we can increase the antenna tilt of the cell with PCI 178. Then in the handover area the signal strength from the cell with PCI 178 is reduced.
