- Counters & statistics.
- Message count at specific network element.
- Compare different message counters against each other.
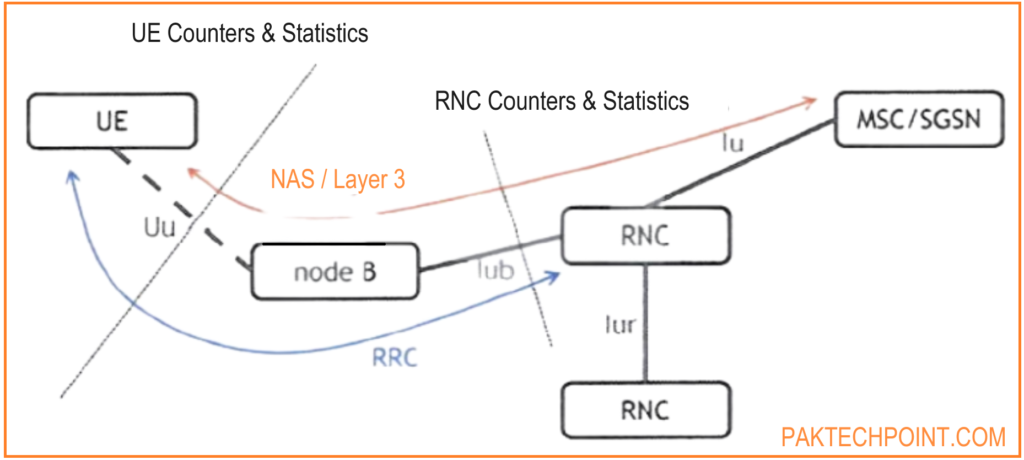
- Introduction to counters & statistics regarding air interface signalling (RRC & NAS).
- UE counters & statistics.
- RNC counters & statistics.

In the following sections, we will introduce counters and statistics, focusing on the signaling present on the air interface: RRC and NAS signaling.
UE Counters and Statistics:
- Captured on Uu Interface: We will first discuss the counters and statistics collected from the user equipment (UE) on the Uu interface.
- RRC and NAS Signaling: Only the signaling related to RRC (Radio Resource Control) and NAS (Non-Access Stratum) will be reviewed.
RNC Counters and Statistics:
- Captured on Iub Interface: Next, we will look at the counters and statistics from the Radio Network Controller (RNC) captured on the Iub interface between Node B and the RNC.
Counters and Statistics:
- Counters: These are message counts performed at specific network elements.
- Statistics: Obtained by analyzing these counters and comparing them against each other to understand network performance and issues.
UE counters & Statistics of UMTS Air Interface Signalling.
- Counters & statistics collected at UE.
- Easily done with drive test log file.
- Easy to collect information on one specific user.
- Provides a zoomed-in view.
- No general (network) performance overview.

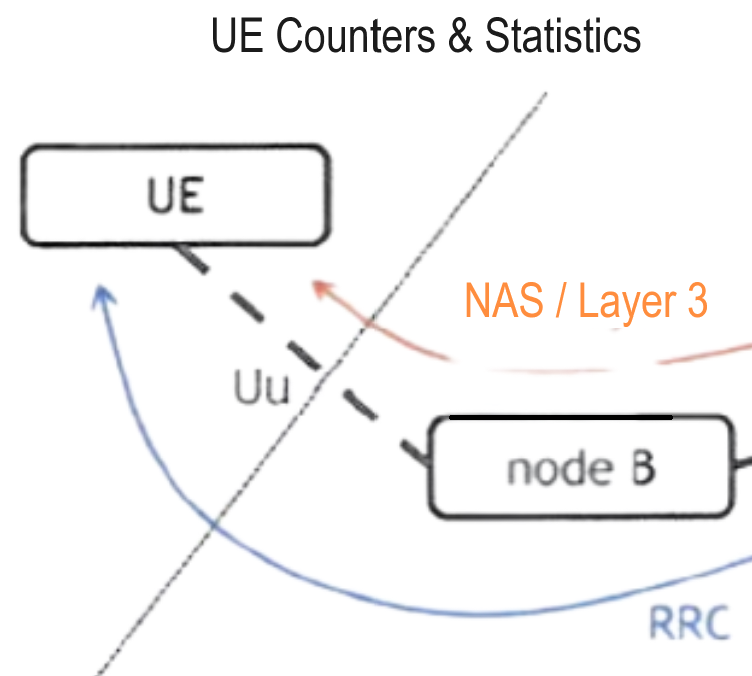
The figure above illustrates how to collect UE counters and statistics related to air interface signaling. This process involves performing a message count on a drive test log file.
Drive Test Log File:
- Message Count: By analyzing a drive test log file, you can count the specific messages exchanged between the UE and the network. This is a straightforward method to collect detailed information on air interface signaling.
Zoomed-In View:
- Specific User Data: This method is particularly effective for gathering detailed information about a specific user. It provides an in-depth, zoomed-in view of that user’s interactions with the network.
Limitations:
- General Network Performance: While this approach is useful for specific user data, it does not provide a comprehensive view of the overall network performance. It focuses on individual interactions rather than network-wide statistics.
Example:
- Message count:
- RRC Connection Setup Complete: 10
- RRC Connection Release: 5
- Compare message counters:
- 5 out of 10 RRC connections not properly released: 5 dropped calls/failed calls.
The figure above provides a practical example of collecting UE counters and statistics at the air interface, focusing on the RRC Connection Setup and RRC Connection Release procedures.
RRC Connection Setup Procedure:
- Three Messages: This procedure consists of three messages and concludes with the RRC Connection Setup Complete message.
- Message Count: In the example, 10 RRC Connection Setup Complete messages have been counted in the log file, indicating that 10 services have been initiated.
RRC Connection Release Procedure:
- Initiation: This procedure begins with the RRC Connection Release message.
- Message Focus: The RRC Connection Release Complete message is not the focus here, as it is often repeated multiple times.
- Message Count: In this example, only 5 RRC Connection Release messages have been counted, indicating that only 5 RRC connections have been properly released.
Analysis:
- Unreleased Connections: Normally, each RRC connection set up at the start of a service should be released at the end of the service.
- Dropped/Failed Calls: The discrepancy in the counts (10 setups vs. 5 releases) suggests that 5 out of 10 RRC connections were not properly released. This indicates 5 dropped or failed calls.
RNC Counters & Statistics of UMTS Air Interface Signalling.
- Counters & statistics collected at RNC.
- Provides a general (network) performance overview.
- No information on one specific user.
- Exactly the same principles as UE counters & statistics.
- But: more difficult to implement because of mobility.

The figure above provides more details on the collection of RNC counters and statistics, specifically for air interface signaling. These counters and statistics offer a general overview of network performance within a specific RNC (Radio Network Controller) area.
General Network Performance:
- Overview: Unlike UE counters and statistics, RNC counters and statistics provide a broad view of network performance across an entire RNC area.
- Scope: This approach helps in understanding how well the network is performing in a particular region controlled by an RNC.
Lack of Specific User Information:
- No User Details: While RNC counters and statistics give a general performance overview, they do not provide detailed information about specific users.
Principles and Challenges:
- Similar Principles: The principles for collecting RNC counters and statistics are similar to those for UE counters and statistics.
- Mobility Complications: Implementation is more complex due to the mobility of users. As users move across different cells and RNC areas, tracking and analyzing data becomes more challenging.
Example:
- Message count RNC1:
- RRC Connection Setup Complete: 1
- RRC Connection Release: 0
- Compare message counters:
- No dropped call/failed call: call released on different SRNC (mobility)!!!
- RNC statistics should take SRNC relocation into account.

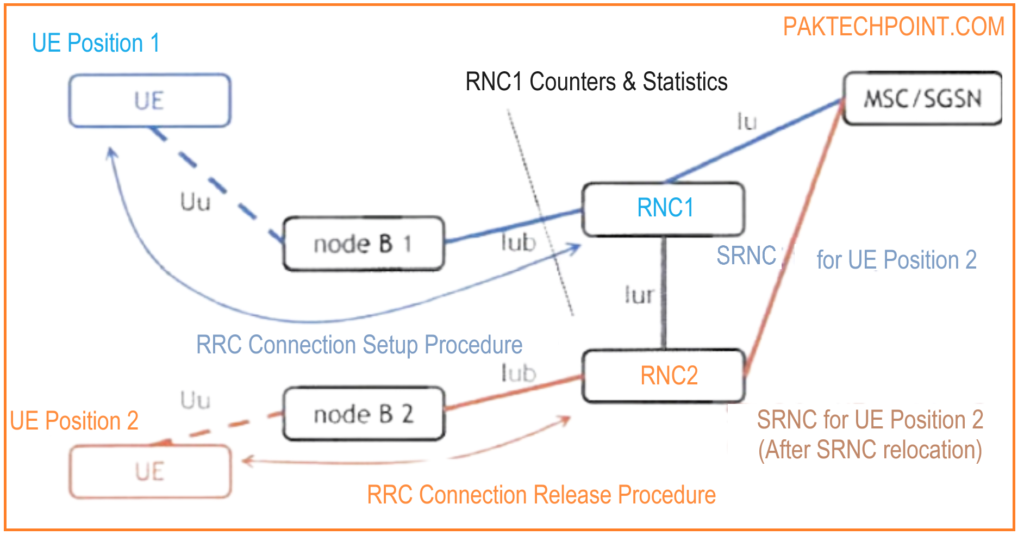
The figure provides a practical example of the principles behind RNC counters and statistics, highlighting the impact of user mobility and RNC handovers.
Position 1:
- RRC Connection Setup: The UE performs the RRC Connection Setup procedure, establishing an RRC connection with the Serving RNC (RNC1), which controls the cell belonging to Node B 1.
- Message Counting: In this position, RRC messages are counted by RNC1, as it is the Serving RNC.
Position 2:
- Mobility and Serving RNC Relocation: As the UE moves to position 2, it transitions to a cell controlled by a different RNC (RNC2). The Serving RNC relocation procedure is performed, transferring control from RNC1 to RNC2.
- New Serving RNC: In position 2, RNC2 becomes the Serving RNC, and RNC1 is no longer involved.
RRC Connection Release:
- End of Service: At the end of the service, the RRC Connection Release procedure is initiated. This involves exchanging RRC messages between the UE and the Serving RNC (now RNC2).
- Message Counting by RNC2: RRC messages related to the release procedure are counted by RNC2.
Impact on Message Counts:
- Unbalanced Message Counts: Due to the mobility of the UE and the Serving RNC relocation, RNC1 will have an unbalanced message count. This unbalance is not due to dropped or failed calls but rather the result of the handover process.
Considerations for RNC Statistics:
- Mobility Factor: RNC statistics must account for user mobility and the associated Serving RNC relocations to avoid misinterpreting the data.
- Implementation Complexity: The need to consider mobility makes the practical implementation of RNC statistics more complicated compared to static UE counters and statistics.
In summary, this example demonstrates the complexity of collecting and interpreting RNC counters and statistics due to user mobility and Serving RNC relocations. Understanding these factors is crucial for accurate network performance assessment.