Eddy Current Proximity Probes for Overspeed Protection Systems
Introduction
Since overspeed is one of the most dangerous conditions that can occur in a turbine, it is essential that overspeed protection systems are properly installed. In the sections below are issues you should consider when applying eddy current proximity transducers in an overspeed protection system.
A diagram shows the terms used in this document for describing gear geometry.
Signal Amplitude at Overspeed
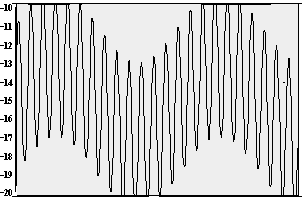
The signal from a transducer system viewing a gear is a complex signal. In other words the signal may contain a vibration and/or runout component as well as the speed component in following figure. Other signal variations could come from inconsistencies in gear tooth dimensions. Normally these components of the signal are small compared to the speed component of the signal. However, when a machine approaches overspeed there must be no doubt which component of the signal represents the speed of the gear.
In order to insure that the speed signal is the dominant signal component, we recommend that the amplitude of the speed signal be greater than 7 Vpp at the overspeed setpoint (200 mV/mil transducer system).
The signal amplitude at overspeed is dependent on factors such as probe gap, gear dimensions, target material, and signal frequency. The general approach to estimating signal amplitude at overspeed is:
- Find the amplitude of the speed signal at slow roll.
- Estimate the amount of signal attenuation at the overspeed setpoint (frequency response).
Since the geometry of the gear affects both the slow roll signal amplitude and signal attenuation, the next section describes three types of gear geometry and shows the typical signal produced by each type.
How Gear Geometry Affects the Signal
Different geometry gears create different types of signals from the transducer. This section describes three types of gear geometry and shows how each type affects the signal amplitude at slow roll. In each of the following examples the tooth depth is beyond the range of the probe, the face width is greater than 16mm and the system used was a 3300 8mm probe with a 330100 Proximitor®.
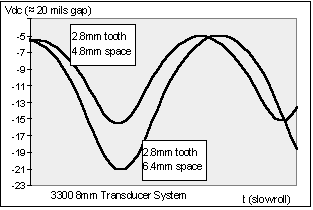
Small Geometry Gear: A small geometry gear has a tooth width and space width that are both smaller than the diameter of the probe. Small geometry gears produce sinusoidal signals but the signal amplitudes may be smaller than desired as shown in following figure.
Signals from 3300 8mm systems viewing small geometry gears. The tooth depth is beyond the linear range of the probe on both gears.
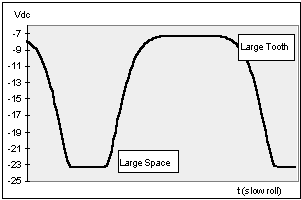
Large Geometry Gear: A gear with tooth widths and space widths larger than the probe diameter is a large geometry gear. Large geometry gears produce signals best described as ‘clipped sinusoids’. These signals may become sinusoidal at higher speeds depending on the gear geometry and the amount of signal attenuation. Large geometry gears with tooth depths beyond the linear range of the probe produce the largest slow roll signal amplitudes.
Following figure shows a signal generated from a large geometry gear. The probe is gapped at -8 Vdc when viewing the tooth. Since the tooth depth is beyond the linear range of the probe, the signal is railed at the supply voltage (-24 Vdc) when viewing the space.
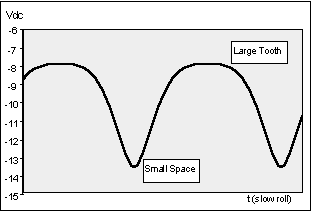
Following figure shows a signal generated from an asymmetrical gear. When viewing the large tooth the output is -8 Vdc. When viewing the space the output does not go to the supply voltage rail (-24 Vdc) because the probe ‘sees’ the teeth on either side of the space (tooth depth is beyond the linear range of the probe). Signal amplitudes of asymmetrical gears vary greatly depending on the gear geometry.
The three types of gears described in this section are very general. It is easy to see that every gear will have its own unique signal. That is why one of the most important things you can do to insure the reliability of your system is verify the characteristics of the transducer signal. One of the most important of these characteristics is the slow roll signal amplitude.
Finding the Slow Roll Signal Amplitude
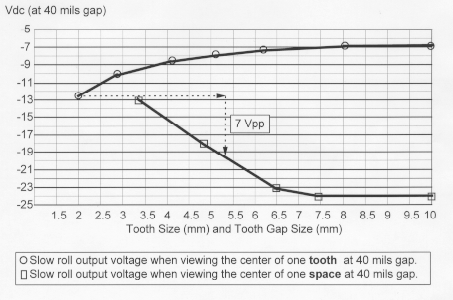
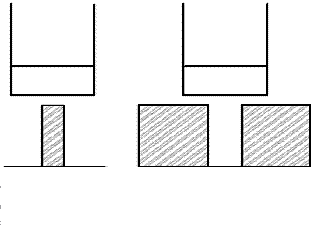
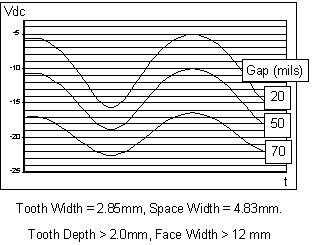
Since gears come in infinite sizes, the best way to find the slow roll signal amplitude is to measure it with the transducer system observing the actual gear. If you cannot measure the amplitude directly, you may be able to use the gear geometry and the data in Figure a to estimate the slow roll signal amplitude. The test setup shown in Figure b was used to gather the data shown in Figure.
The results shown in Figure 6 are especially useful because they illustrate the relationships that exist between the output voltage, the tooth width, and the space width. Given a certain gear geometry, you can use the graph in Figure 6 to approximate the output voltage (Vpp) of an 8mm probe gapped at 40 mils. Do not use the graph (Figure 6) to predict exact voltage levels for a specific gear geometry. It may provide a reasonable estimate but remember that each system differs depending on gap, tooth geometry, target material, probe viewing angle, etc.
The slow roll signal amplitude is an important parameter because it is used in calculating the signal amplitude at overspeed and it is easily verified. Once the slow roll signal amplitude is known, the signal amplitude at overspeed is calculated based on the speed signal frequency and the frequency response of the transducer system.
Estimating the Amount of Signal Attenuation
In order to estimate the amount of signal attenuation, the signal frequency at overspeed must be known. For most gears this is easily calculated. However, the signal frequency at overspeed of an asymmetrical gear must be computed more carefully.
For example, Figure shows two transducer signals at slow roll. The asymmetrical gears being observed both have large teeth and small spaces. Gear 2 has slightly larger teeth and slightly smaller spaces than gear 1. Otherwise, the gears are the same size with the same EPR. Normally, the frequency of the signal is computed as F=RPM/60 x EPR. This is equivalent to F=1/T (T=Period of the signal). Computed in this manner, these two signals have the same frequency (T1=T2). However, these signals will not behave the same at high speeds.
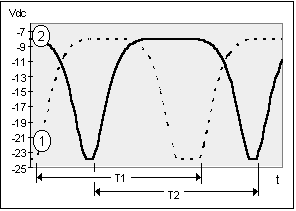
Frequency is a function of how much the signal is changing over time. Over the full period both signals change the same amount. However, signal 2 makes the transition from -8 Vdc to -24 Vdc to -8 Vdc in less time than signal 1. Therefore, over this portion of the waveform signal 2 changes more over time. At high speeds signal 2 will attenuate more than signal 1.
In order to deal with the problem of calculating the signal frequency two equations are suggested.
For small gears and for symmetrical gears equation 1 is most appropriate.


For asymmetrical gears equation 2 is more appropriate.
A = smaller of tooth or space dimension
B = larger of tooth or space dimension

When using equation 2 the frequency computed is not the actual frequency (1/T) of the signal. It is a worst case frequency based on the portion of the gear that causes the transducer signal to change the most over the smallest amount of time. In other words it is the frequency of the signal when the probe is viewing the smallest gear dimension. For asymmetrical gears equation 2 is more appropriate.
Equation 1 gives a best case estimate and equation 2 gives a worst case estimate. Combine these two methods to provide an approximation of the frequency response required for your transducer system.
When using these formulas, signal frequencies up to 6 kHz (330100 Proximitor®) should pose no problems if cable lengths between the overspeed monitor and the transducer are kept below 1000 feet (300 Metres).
For frequencies near or above 6 kHz, approximate the signal amplitude of the transducer system using equation 3.

Equation uses 6000 Hz for the frequency response (-3dB) of the transducer system (using p/n 330100). This number is conservative because frequency response changes with gap. In general, frequency response improves at smaller gaps and declines at larger gaps. The following section shows how to use these equations for a specific system.
Example
An AISI 4140 gear with 120 EPR is shown in Figure. The transducer system is a 3300 8 mm 5-M system. The probe gap is 50 mils from the tooth. The operating speed is 3600 RPM and the overspeed setpoint is 3978 RPM.

What is the estimated output voltage (Vpp) at the overspeed setpoint?
STEP 1: Approximate the output voltage at slow roll. The teeth are large; therefore at 50 mils gap, when viewing the tooth, the output will be about -9 Vdc. When viewing the space the output will be -17 Vdc (90 mils from target). The estimated output is 8 Vpp.
STEP 2: Calculate the signal frequency (F) using equation 1.

STEP 3: Calculate the signal amplitude (Vpp) at overspeed using equation 3 and the frequency (F) calculated in Step 2.

STEP 4: Calculate the signal frequency (F) using equation.

STEP 5: Calculate the signal amplitude (Vpp) at overspeed using equation 3 and the frequency (F) calculated in Step 4.

STEP 6: Compare the results of Steps 3 and 5.
At the overspeed setpoint the output voltage will be somewhere between 4.133 Vpp and 4.817 Vpp.
The estimated frequency response of the transducer system was 6 kHz. If the probe gap is safely reduced, the frequency response will improve. If the frequency response improved to 8.0 kHz at 20 mils gap then the estimated output is between 5.67 and 5.01 Vpp.
In this example the amplitude of the speed signal is less than 7 Vpp. However, this may be acceptable depending on your monitoring system and the amplitude of other signal components such as vibration and runout. The next section provides specific guidelines concerning vibration and runout signal components.
Distinguishing Speed from Vibration
Signal Amplitude
The signal generated by a transducer with a 200 mV/mil scale factor should output at least 7 Volts peak to peak (Vpp) at the overspeed setpoint. A speed signal with this amplitude should be sufficient to differentiate the speed signal from any other signal present. Most applications will easily meet these requirements.
Large Vibration and/or Runout Signals
For gears with large amounts of vibration or runout, the amplitude of the speed signal should be at least twice as large as the vibration or runout signal present at the speed measurement location.
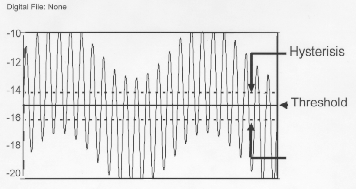
Figure shows an 8.0 Vpp speed signal with a 4.0 Vpp vibration signal present at the speed measurement location. The threshold of the monitoring system is set at -15 Vdc and the hysterisis is set at 2 Volts. If the amplitude of the speed signal is reduced, or if the vibration signal increases the monitor could start missing events.

In the previous section it was shown that the transducer signal attenuates at high frequencies. It is important to note that vibration and runout signals will not attenuate the same as the speed signal. This is because the vibration and runout signal components are at different frequencies. For example a small gear with 60 EPR rotating at 3600 RPM has a speed signal frequency of 3600 Hz. The 1X vibration component of the rotational speed is 60 Hz; much slower than the 3600 Hz speed signal.
Installation Issues
Minimum Gear Dimensions
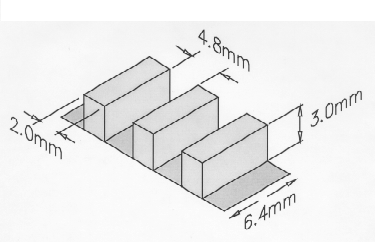
Table 1 shows signal amplitudes from a 3300 8 mm probe and a 330100 Proximitor® measured while observing the gear in (see Figure). Tooth dimensions smaller than those shown may no longer provide sufficient signal amplitude.
Figure: When using an 8mm probe, tooth dimensions smaller than those shown may not provide sufficient signal amplitude (this does not include the 3mm tooth depth dimension).
| Probe Gap | Output Voltage at Slow Roll |
| 40 mils | 6 Vpp |
| 30 mils | 7 Vpp |
| 20 mils | 8 Vpp |
Signal Threshold of the Monitoring System
The ideal threshold of the monitoring system is the value that is midway between the most positive peak and the most negative peak of the transducer signal (see Figure). When using proximity transducers, the midway voltage at operating speed is usually unknown because the midpoint depends on gap, gear geometry, speed and vibration. Therefore, Auto Threshold is recommended when using proximity transducers.
Load Impedance/Cable Length
Bently Nevada Corporation eddy current proximity transducers can drive up to 1000 feet of twisted pair cable into a 10 K Ohm load with no appreciable degradation in frequency response. Therefore it is recommended to keep cable length between monitor and transducer below 1000 feet (300 metres).
Probe Location
Any transducer used for overspeed protection must be mounted on the driver side of the coupling. Also, any target observed should be an integral part of the rotating shaft.
Probe Gap
If the tooth depth is greater than the linear range of the probe then the signal amplitude can be increased by gapping the probe closer to the gear (Figure). Larger gaps, however, improve safety by decreasing the chance of the probe contacting the gear. Smaller probe gaps will also improve the frequency response of the transducer system.
Conclusion
Eddy current proximity transducers work well in most overspeed protection applications but it is important to understand that there are limitations to their use. Bently Nevada Corporation is ready to help you engineer and install the proper proximity transducer to provide a reliable and effective signal for your overspeed monitoring system.