When designing a ship early on, there are two main ways to figure out its main dimensions:
- Empirical Method: This method uses data from other ships that are similar to the one being designed. The data might come from public or private databases and are often shown on graphs. This approach assumes that the data is accurate and that the ships in the database were well-designed in terms of cost and efficiency.
- Parametric Method: With this approach, designers start fresh and try out different combinations of Ship dimensions and shapes to meet specific goals and requirements. For example, they might aim to minimize the cost of operating or building the ship. This method is used when there isn’t enough data available for similar ship designs. It allows designers to create new designs tailored to their specific needs.
Selection factors for Ship Dimensions
When selecting the main ship dimensions of a ship, several factors need to be considered to meet various requirements and regulations. These factors influence the hydrodynamic performance, stability, structural strength, cargo capacity, and construction costs. Here are the key considerations for each dimension:
- Length (L):
- Influences displacement, speed, and construction costs.
- Affects calm water resistance and seakeeping performance.
- Significant impact on ship motions, accelerations, and added resistance in rough seas.
- Breadth (B), Draught (T), and Depth (D):
- Interconnected dimensions affecting form coefficients and cargo capacity.
- Hold volume depends on cargo type and stowage factor, influencing depth requirements.
- Transverse stability heavily influenced by breadth.
- Maneuvering and propulsion efficiency impacted by draught.
- Wave added resistance affected by both breadth and draught, while slamming influenced by draught.
- Freeboard requirements influence draught and depth selection.
- Crucial for damage stability and longitudinal strength.
- Physical and Operational Constraints:
- Constraints imposed by ship routes, port drafts, shipyard facilities, bridge clearances, etc.
- May override initial mission and performance objectives.
Practical approaches for deciding main ship dimensions include:
- Normand’s Number: A method based on empirical data.
- Statistical and Direct Calculations: Using statistical analysis or direct calculations to determine dimensions based on specific criteria and objectives.
By considering these factors and employing suitable approaches, ship designers can optimize main ship dimensions to meet the ship’s requirements effectively.

Normand’s number
Normand’s number (N) approach is a method used in ship design to estimate the change in total displacement resulting from changes in one or more weight components of a ship.
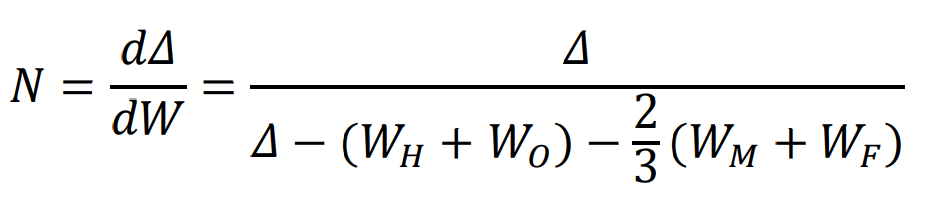
In the Normand’s number approach:
- ΔW is the difference between the deadweight of the new design and the reference ship.
- ΔD is the difference in displacement between the new design and the reference ship.
- WH is the hull weight of the reference ship.
- Wo is the outfitting weight of the reference ship.
- WM is the machinery weight of the reference ship.
- WF is the fuel weight of the reference ship.
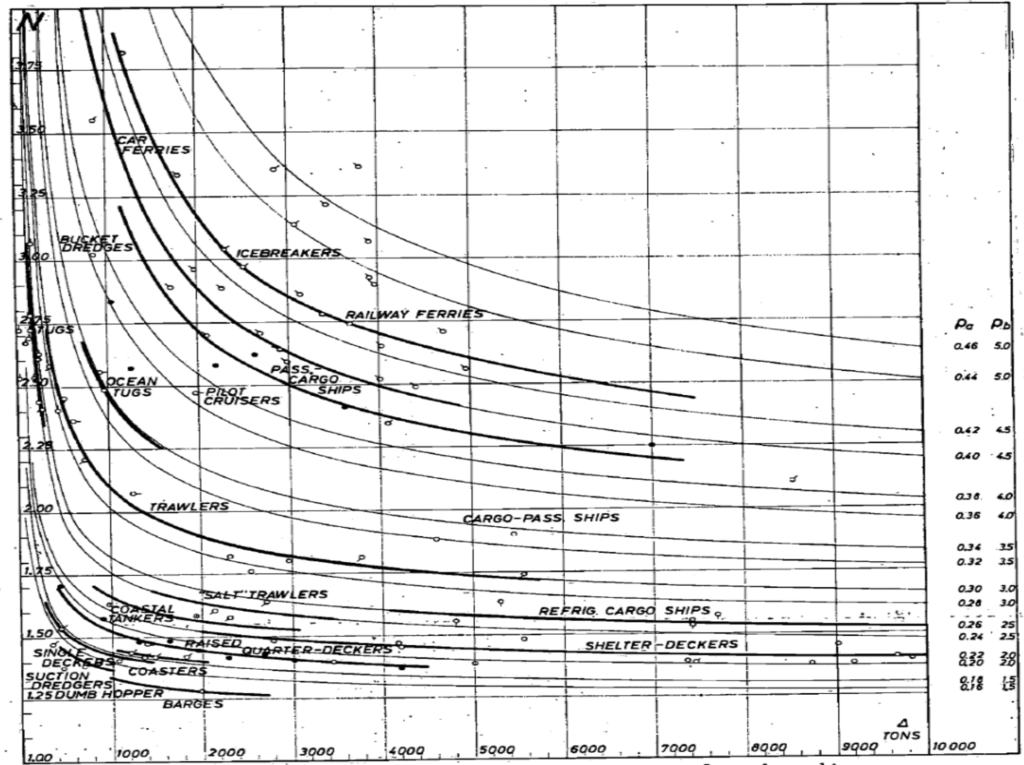
A challenge in the Normand’s number approach is the scarcity of available data. To address this, empirical charts are often utilized, as shown in Figure 3-1. These charts aid in determining the main ship dimensions by keeping one or two of the reference ship’s characteristics constant, such as the block coefficient (Cb).

Statistical approach
In the statistical approach, empirical methods are employed to determine a ship’s main dimensions. This involves utilizing various procedures, curves, and regression-based equations to make decisions regarding the ship’s key characteristics. Here’s an example of the process:
- Calculate the displacement of the new design using tabular values of deadweight displacement ratios, with the deadweight being known as per owner requirements.
- Determine the length of the ship using regression-based equations derived from statistical data.
- Calculate the block coefficient using regression-based equations.
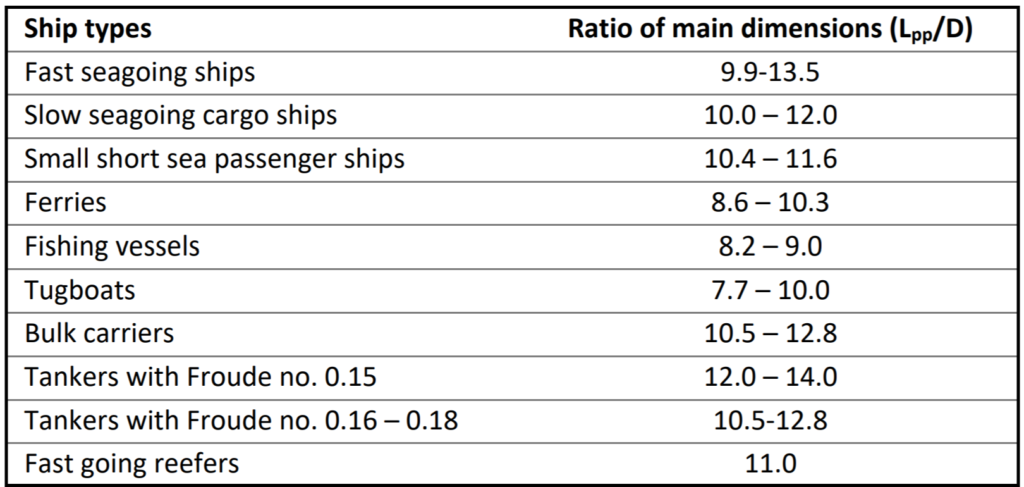
- Estimate the length-to-breadth ratio based on empirical formulae or tabular values, then calculate the breadth accordingly.
- Calculate the draught based on the displacement, breadth, length, and block coefficient, while considering any limitations on draught, D/T, or B/T ratios.
- Determine the length-to-depth ratio using tabular values from statistical data, then obtain the depth of the ship.
For instance, statistical tables for ship design provided by sources like Papanikolaou (2014) can be utilized to compare the new ship’s parameters with existing ships, ensuring they fall within a normal range. This comparison helps validate the selected ship dimensions for the new design.
Direct calculations
Direct calculations are employed when there is insufficient data available from similar types or sizes of ships, or when the new design is unconventional in shape or size. In such cases, designers must start the design process from scratch, considering the objectives, requirements, and constraints involved. The goal is to find the optimal combination of dimensions and form characteristics that will meet the specified objectives.
However, during the preliminary design stages, accurately defining the relationships between different ship parameters and the desired economic objectives can be challenging. As a result, solutions are often implemented during the detailed design stage using mathematical optimization models embedded in commercial software packages such as NAPA, Rhinoceros, or MAXSURF. These software tools help designers refine and optimize the ship’s design to achieve the desired performance and functionality.
Practical examples
Let’s say you’re tasked with designing a new container ship for a shipping company. This ship will be similar to the last one they built, but they want to increase its deadweight capacity by 5,000 tons to make it more cost-effective. The maximum draught allowed for this ship is 9 meters, and they also want to improve fuel efficiency by increasing the length-to-breadth ratio to 7.5.
To figure out the ship’s size and other important characteristics, we’ll use two methods: Normand’s number and the statistical approach. For both methods, we’ll assume that the block coefficient, which measures the fullness of the ship’s hull form, remains constant.
With Normand’s number, we’ll calculate a factor that represents how much the ship’s overall displacement changes with respect to changes in its weight components like deadweight. Then, we’ll use this factor to estimate the new ship’s displacement and other characteristics.
With the statistical approach, we’ll use equations, tables, and regression-based formulas to estimate the ship’s length, breadth, draught, and other ship dimensions based on data from similar ships. We’ll also ensure that the new design meets the company’s requirements and fits within the operational profile of their fleet.
1. Solution using Normand’s number approach
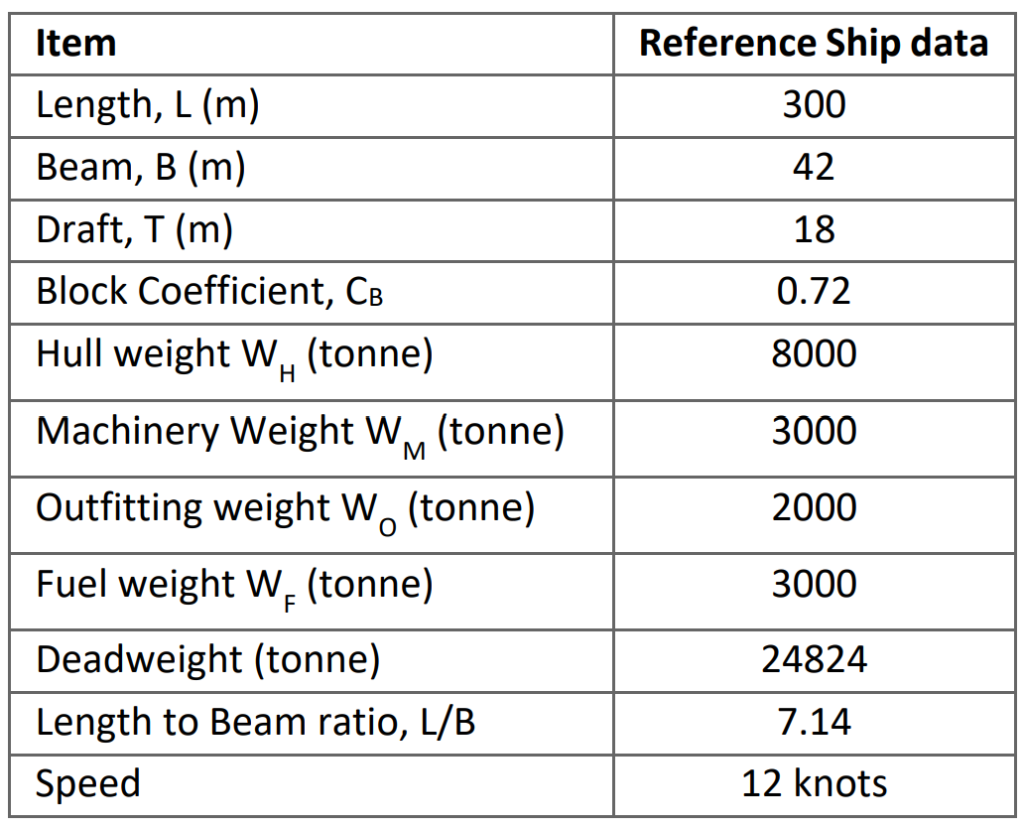
To calculate the displacement of the reference ship, we’ll use the formula:
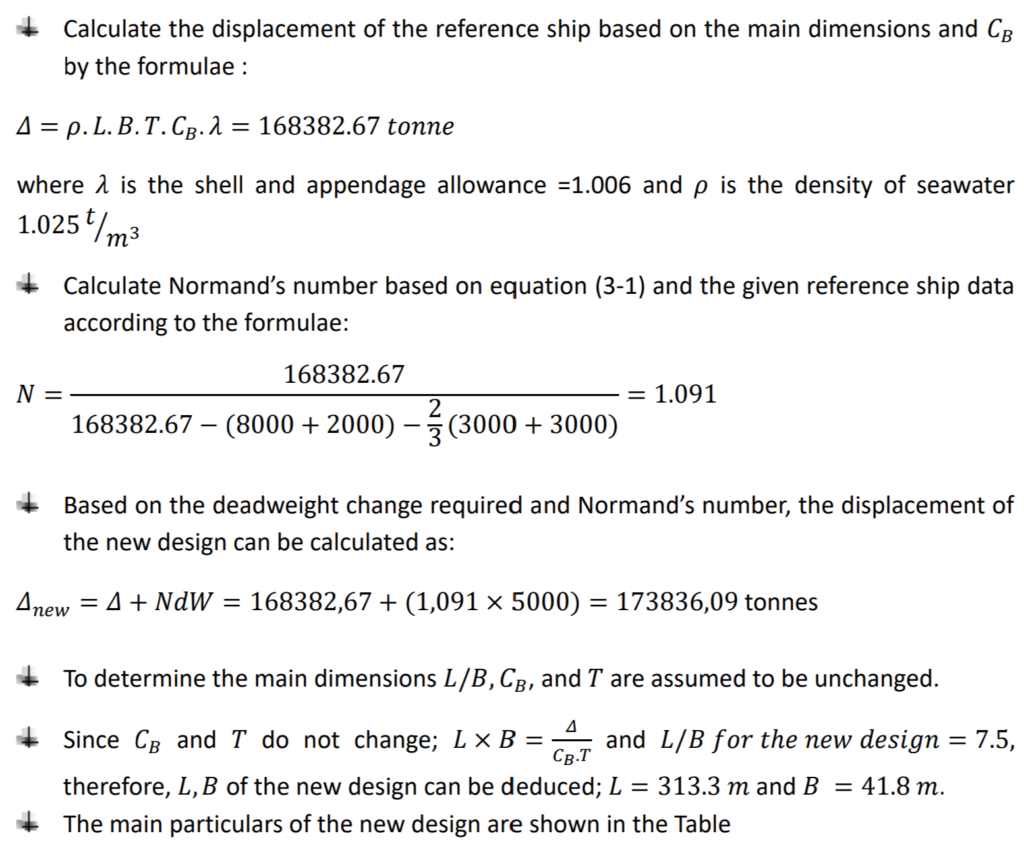
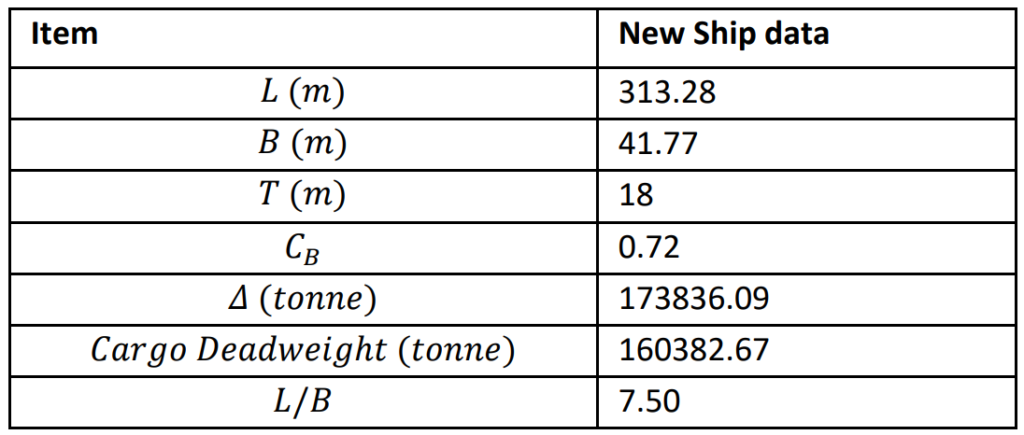
2. Solution using the statistical approach
o estimate the ship displacement for the required deadweight using the statistical approach, we can use the deadweight to displacement ratio from Table. Let’s assume the closest type of ship to our container vessel and use its deadweight to displacement ratio.
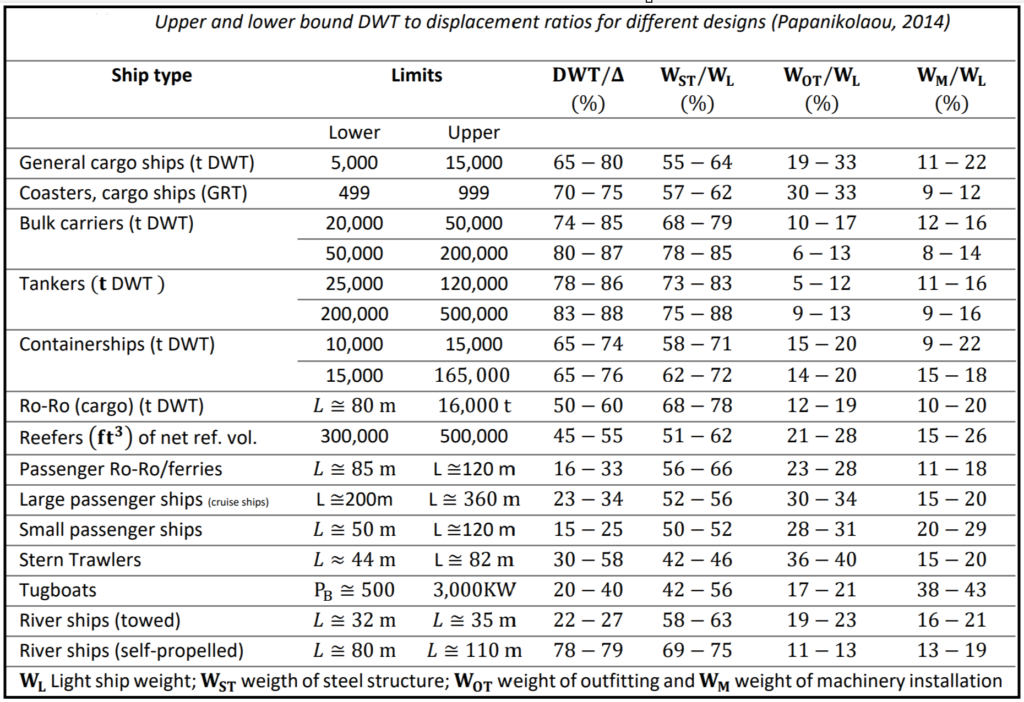

Upper and lower bound Lpp to depth ratios for different designs.