Since the inception of the IEC 60076-18 standard back in 2012, the Sweep Frequency Response Analysis (SFRA) method has emerged as a widely adopted electrical testing technique for power transformers. This method offers a comprehensive assessment of both the mechanical and electrical aspects of a power transformer’s active components. Unlike conventional diagnostic approaches, SFRA exhibits sensitivity to external electrical interferences, which can occasionally hinder comparability and potentially lead to misinterpretation of measurement outcomes. In this article, we delve into the theory underpinning various sources of noise and strategies for noise mitigation. We present several case studies that illustrate the effectiveness of SFRA measurements, even when conducted under challenging environmental conditions.
What is SFRA?
Power transformers remain among the most expensive and critical components within an electrical power network. Consequently, the need for a dependable assessment of their condition has grown significantly, particularly given the aging of transformer fleets. The Sweep Frequency Response Analysis (SFRA) has emerged as a pivotal standard test, offering a comprehensive evaluation of both the mechanical and electrical aspects of a power transformer’s active components.
SFRA facilitates the detection of electrical and geometrical alterations within the magnetic core, winding assembly, and clamping structure by comparing current measurements with reference data. Unlike conventional diagnostic techniques, SFRA is sensitive to external electrical disturbances, which can sometimes hinder comparability and lead to potential misinterpretations of measurement outcomes.
To effectively mitigate both narrowband and broadband noise, a combination of software-based and hardware-based techniques can be employed. This article delves into the theory surrounding various noise sources and strategies for noise reduction. Furthermore, it presents several case studies highlighting the effectiveness of SFRA measurements, even when conducted under challenging environmental conditions.
Since the introduction of the IEC 60076-18 standard in 2012, the Sweep Frequency Response Analysis (SFRA) method has gained widespread acceptance in the field of electrical testing for power transformers. It has emerged as a crucial diagnostic tool, offering comprehensive insights into the mechanical and electrical health of the active components within power transformers. Various external factors like transportation, seismic events, power fluctuations, and more can potentially impact the integrity of transformer windings, connections, and the transformer core. Notably, SFRA has proven to be exceptionally sensitive in detecting both mechanical and electrical anomalies arising from these factors.
To conduct SFRA measurements, a low output voltage typically ranging from 0.1 V to 10 V is applied, sometimes under challenging environmental conditions. However, the accuracy of the results can be compromised by the presence of noise. In such instances, misinterpretations of the results can lead to unwarranted maintenance or repair actions. Therefore, it becomes essential to differentiate between deviations caused by genuine mechanical or electrical issues and those influenced by noise. This article centers on the impact of noise in SFRA measurements and explores strategies to mitigate its effects.
Sweep Frequency Response Analysis (SFRA) Method
The Frequency Response Analysis (FRA) method encompasses two primary techniques: Impulse Frequency Response Analysis (IFRA) and Sweep Frequency Response Analysis (SFRA). While both methods involve comparing the frequency response of a power transformer to an established reference measurement, they differ in their approach. IFRA employs an impulse in the time domain, whereas SFRA evaluates a frequency sweep. Given that IFRA is more susceptible to noise and SFRA has become the industry standard, this article will concentrate on SFRA techniques.
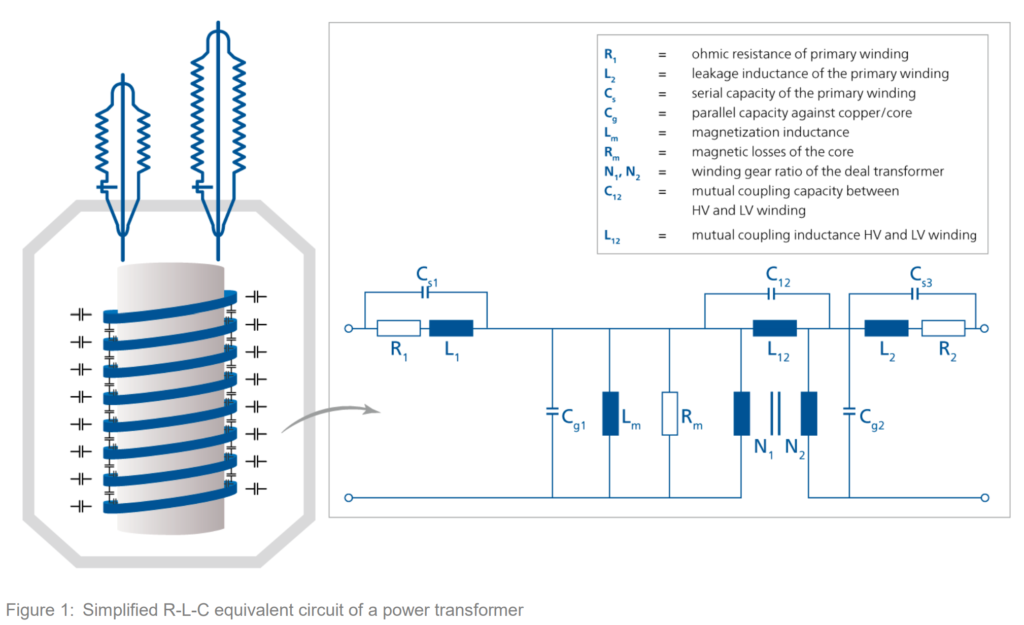
Power transformers can be conceptualized as intricate electrical networks comprised of capacitances, inductances, and resistors, as depicted in Figure 1. Each of these electrical networks exhibits a unique frequency response. Deviations between the current measurement and the reference measurement can serve as indicators of internal component changes. These deviations are associated with specific segments of the frequency range and can be distinguished from one another.
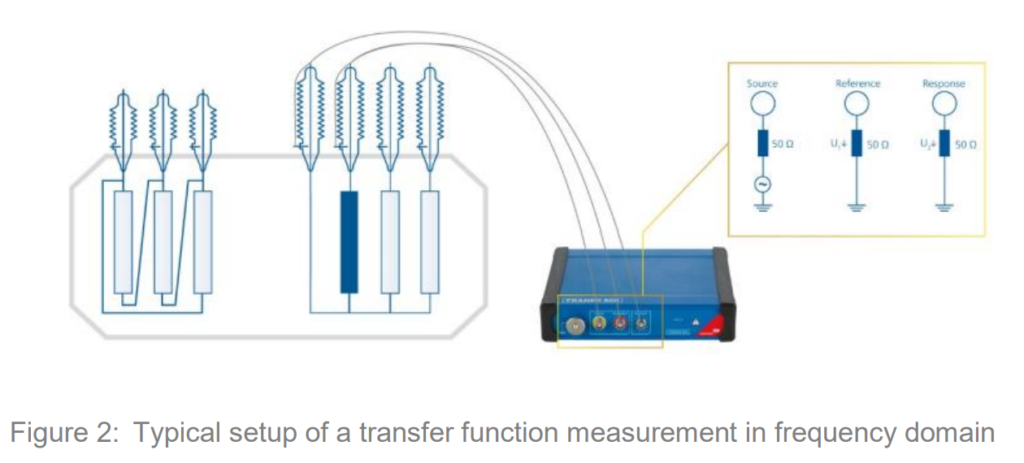
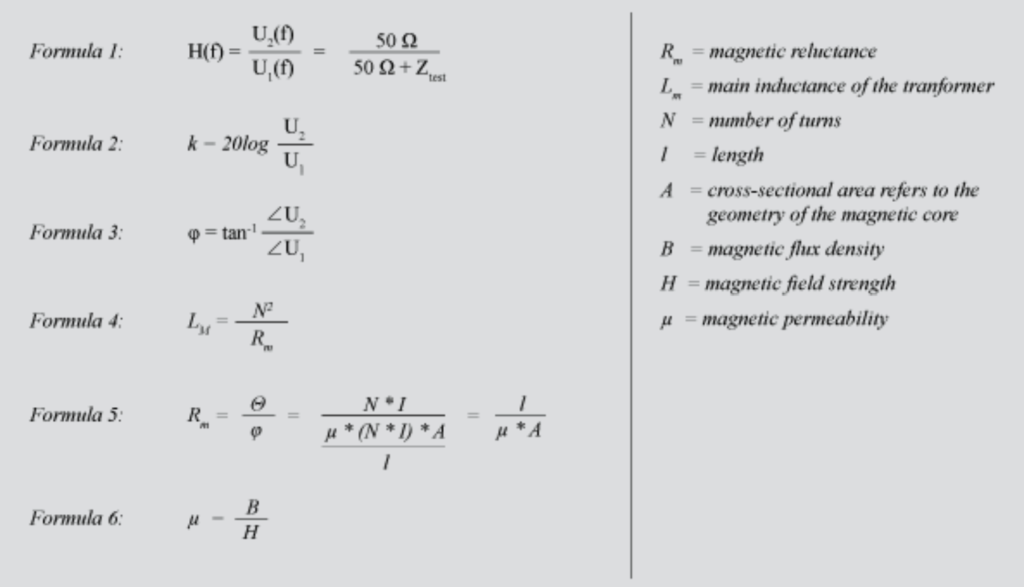
To perform an SFRA measurement, a sinusoidal low-voltage signal with a variable frequency ranging from 0.1 V to 10 V is applied to one end of a winding, as illustrated in Figure 2. To precisely determine the signal’s amplitude, phase, and frequency at the injection point, a reference measurement channel (U1) is connected. Concurrently, the response signal at the opposite end of the winding is recorded (U2). This allows for the calculation of the transfer function H(f) as defined by equation (1). Since SFRA directly operates in the frequency domain, it eliminates the need for additional data processing.
Measurement results obtained through SFRA are typically presented in the form of a Bode diagram, where two key parameters, magnitude (k) and phase (φ), are calculated using simple formulas 2 and 3. These calculations rely on the transfer function H(f) derived from formula 1. The magnitude (k) measured by SFRA equipment is defined by formula 2, while the phase (φ) measured by the same equipment is defined using formula 3.
SFRA is typically conducted within a frequency range of 20 Hz to 2 MHz, employing output voltages between 0.1 and 10 V. In this frequency range, SFRA proves to be a highly dependable and effective test for detecting mechanical and certain electrical failures in the active components of power transformers. Any identified faults can be further corroborated by additional diagnostic measurements such as leakage reactance, exciting current, or winding resistance assessments.
By employing SFRA, various issues can be detected through comparative analysis, including:
- Axial and radial winding deformation
- Displacements between high- and low-voltage windings
- Partial winding collapse
- Shorted or open turns
- Faulty grounding of core or screens
- Core movements
- Broken clamping structures
- Problematic internal connections
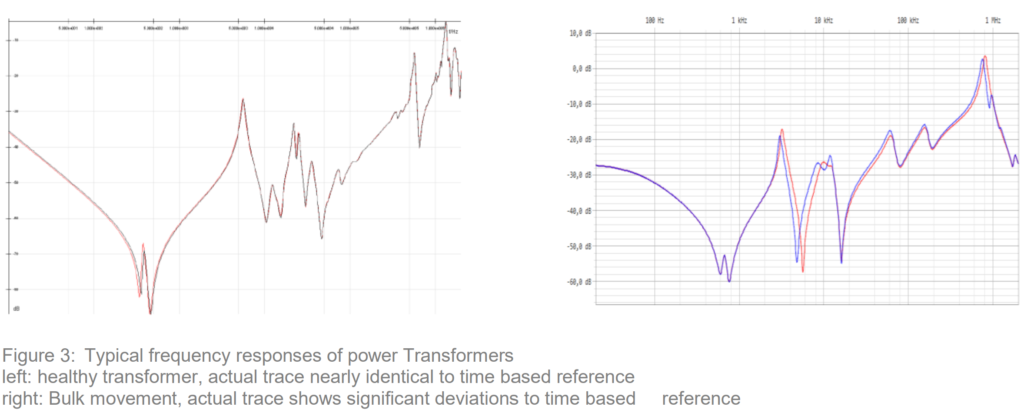
In cases involving healthy transformers, the measured trace closely aligns with the reference SFRA trace across the entire frequency range. This reference trace can either be a fingerprint from a previous measurement of the same transformer or an SFRA trace from a sister transformer with identical specifications. However, when failures occur due to factors like exceptionally high mechanical forces, transportation-related shocks, seismic activities, or mains power failures resulting in high short-circuit currents, the trace exhibits deviations in specific frequency ranges (Figure 3). As SFRA relies on comparative analysis, noise should not significantly impact the magnitude and phase of the frequency response, a topic that will be explored in detail in subsequent sections.
Noise Sources:
In substation environments, especially when conducting SFRA measurements, various sources of noise can affect the accuracy of the results. Broadly, these noise sources can be categorized into two main types: narrowband and broadband noise.
Narrowband Noise
Narrowband noise, often associated with power frequency noise and its harmonics, can have a notable impact on SFRA measurements. These harmonics are multiples of the power frequency used in the electrical grid system.
In general, narrowband noise tends to affect SFRA plots within the low-frequency range, typically between 30 Hz and 100 Hz. Its influence becomes less significant as you move beyond 300 Hz. However, in substations with high levels of harmonic pollution, some narrowband noise may still be observed. The most pronounced effects of noise occur between 3 Hz and 100 Hz, especially in environments with high electromagnetic field strengths, often found in substations with rated voltages exceeding 380 kV.
The type and size of the transformer windings play a crucial role in determining the impact of noise on frequency response results. The signal’s attenuation increases with the inductance of the winding, making the response signal more sensitive to noise. Notably, noise effects primarily occur in the very low-frequency range, where linear magnetization inductance dominates the frequency response.
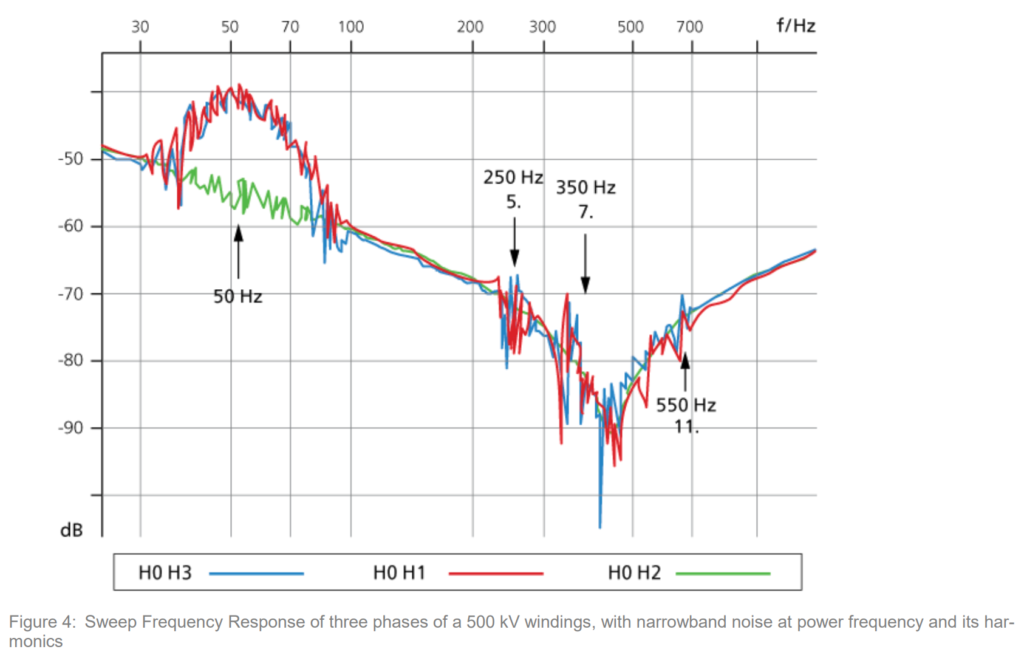
It’s important to note that the presence of narrowband noise does not significantly affect the interpretation of the mechanical condition of a power transformer’s active part. Mechanical issues are typically identified at resonance points above 130 Hz. However, electrical failures in power transformers, such as short circuits between turns, open circuits, or shorted core laminates, can be detected by analyzing the low-frequency area of SFRA plots. As shown in Figure 4, this analysis can reveal these effects in the 500 kV windings of a power transformer.
Broadband noise
Broadband noise is an inherent aspect of SFRA measurements, contributing to the overall noise floor present in SFRA plots. This type of internal noise, categorized as broadband noise, is primarily generated by the SFRA test equipment itself. The magnitude of this noise is contingent upon the dynamic range of the specific SFRA testing instrument in use.
In signal theory, the noise floor is defined as the cumulative effect of all noise sources and unwanted signals within a measurement system. It serves as an indicator of the minimum signal strength that can be reliably measured. The noise floor of an FRA (Frequency Response Analysis) instrument is determined by its dynamic range.
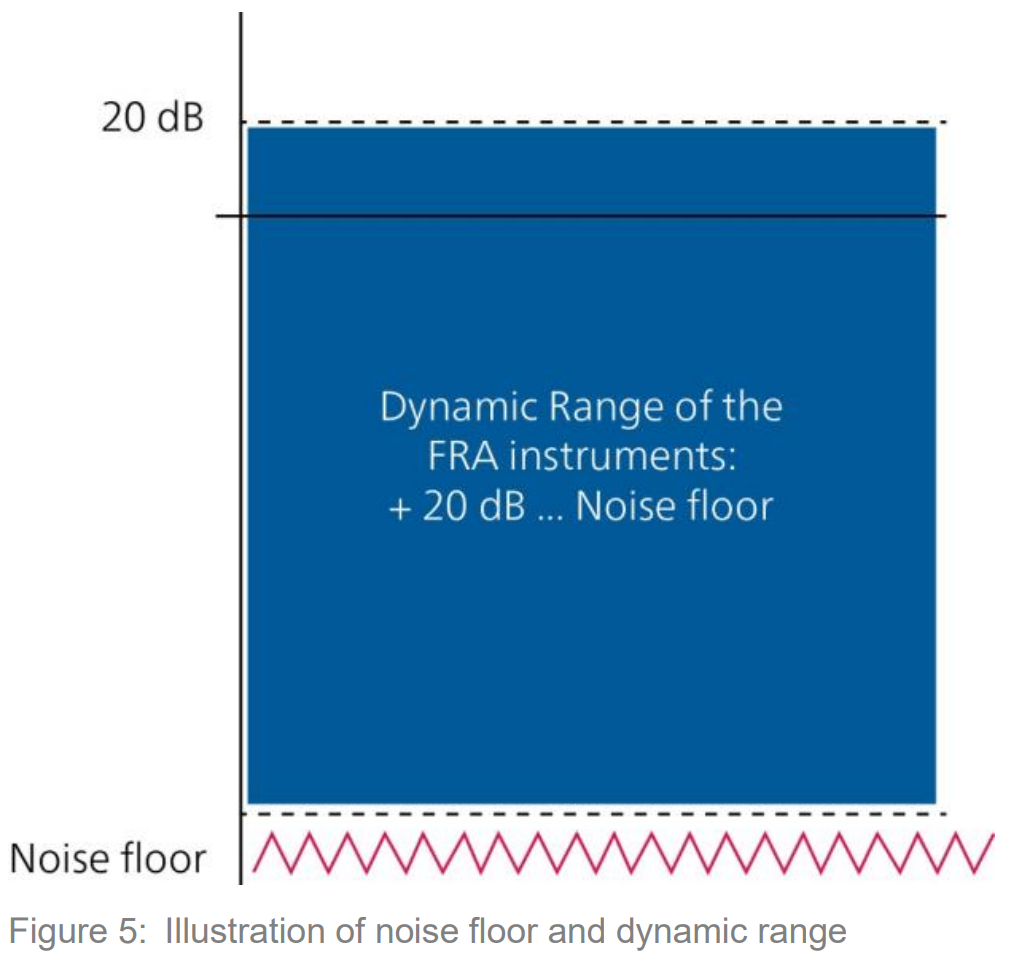
According to the IEC 60076-18 standard, the dynamic range is specified with a minimum device-specific requirement of -90 dB to +10 dB. However, based on accumulated experience, an alternative method to calculate the dynamic range involves taking the absolute value of the negative measurement range and adding 20 dB. This calculation approach is depicted in Figure 5.
This concept of dynamic range and noise floor is crucial for understanding the measurement capabilities and limitations of SFRA equipment.
In contrast to the impact of narrowband noise, the effects resulting from the noise floor are considered highly critical in SFRA measurements. This particular type of noise is typically observed in SFRA plots for power transformers characterized by high magnetization inductance, windings configured in a delta arrangement, or during capacitive interwinding measurements. Noise floor presence significantly complicates result interpretation, as it can affect several resonance points that provide essential asset-related information.
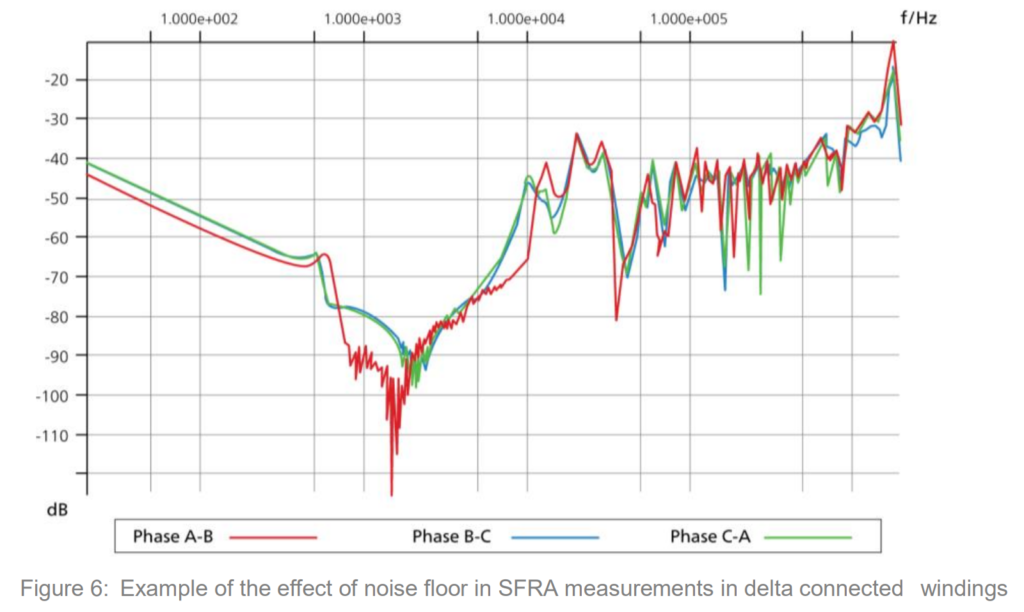
To illustrate the influence of the noise floor, consider Figure 6, which depicts an example. In this scenario, an SFRA measurement was conducted on a power transformer featuring a delta winding configuration using an SFRA instrument with a noise floor of -80 dB. The graph illustrates that the frequency response below -80 dB is substantially impacted by the noise floor. This effect arises due to the limited dynamic range inherent to the SFRA instrument in use.
To prevent this issue, it is advisable to select an SFRA test instrument with a dynamic range exceeding 100 dB. Contemporary SFRA devices, for instance, offer dynamic ranges of greater than 150 dB, enhancing the reliability and accuracy of the measurements.
Noise prevention techniques
Various methods are available to minimize the impact of external disturbances on SFRA traces, with these approaches falling into two primary categories: hardware-based techniques and software-based methods.
4.1 Hardware-based techniques
To minimize noise interference in SFRA measurements, various hardware-based approaches are available for SFRA systems. These techniques encompass specific connection methods, input filters, and adjustable output voltage.
4.1.1 Reliable connection technique
A reliable connection technique plays a crucial role in reducing the impact of external interferences. The IEC 60076-18 standard provides detailed recommendations for establishing a proper and reproducible measurement setup.
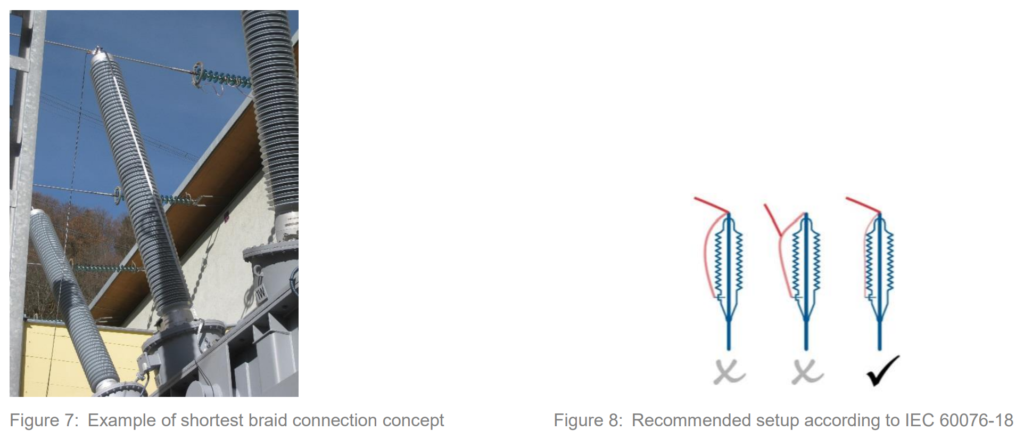
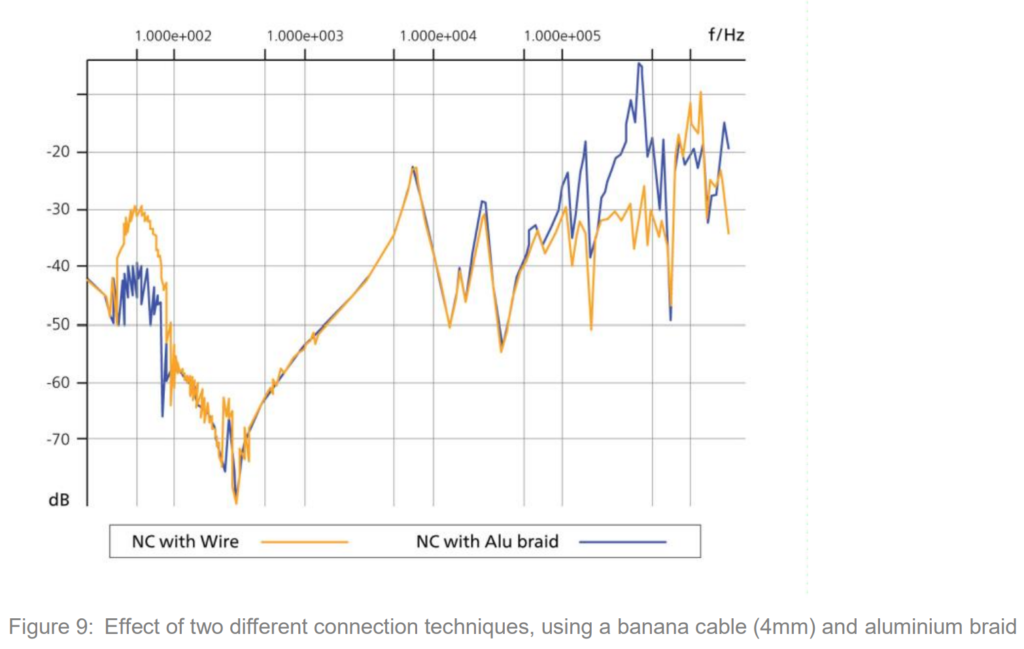
To achieve the highest signal-to-noise ratio, the standard suggests the use of double-shielded coaxial cables grounded by wide, flat aluminum braids. This grounding configuration offers a substantial surface area, minimal inductance, and increased resistance to narrowband noise.
To ensure that the grounding system does not affect SFRA results, the grounding braids should tightly follow the bushing’s body, known as the “shortest braid concept” (see Figure 7 and Figure 8). The choice of connection technique significantly affects reproducibility, particularly at high frequencies, such as above 500 kHz. Compared to standard cables, an aluminum braid can substantially reduce noise interference (as shown in Figure 9).
4.1.2 Advanced input filters
Most SFRA test instruments come equipped with input filters designed to suppress narrowband noise up to a certain level. These noise suppression capabilities can be adjusted by modifying the measurement bandwidth. However, bandwidth settings involve a trade-off between noise suppression and measurement time.
Optimal bandwidth settings can be achieved by dynamically adapting the receiver bandwidth based on signal attenuation. According to the IEC 60076-18 standard, measurements below 100 Hz require a maximum bandwidth resolution of 10 Hz, while measurements above 100 Hz should be less than 10% of the measurement frequency or half of the interval between adjacent measuring frequencies.
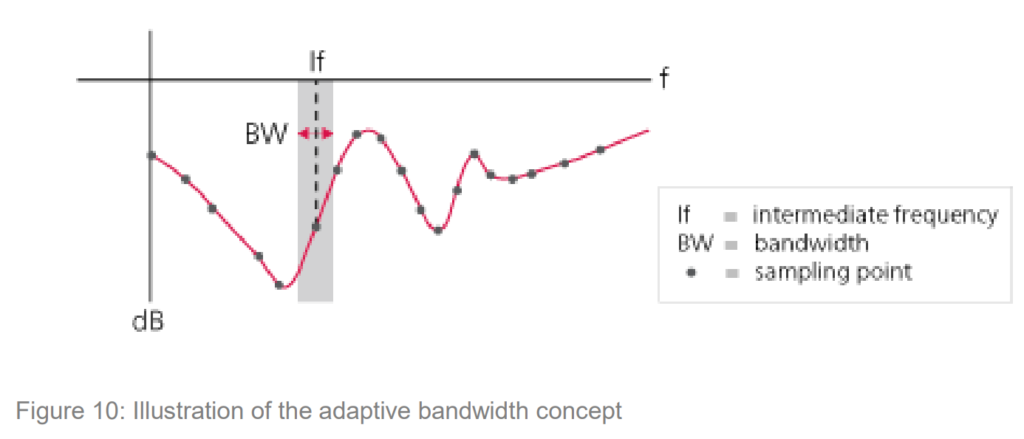
Sophisticated SFRA instruments employ intelligent bandwidth algorithms that automatically select the ideal bandwidth during measurements. This approach involves conducting a broadband measurement to identify critical frequency areas. Subsequently, only narrowband measurements are performed in these identified/distorted areas, aligning with the IEC requirements. This concept is illustrated in Figure 10. By focusing measurements within the bandwidth range, noise suppression capabilities can be improved without compromising measurement accuracy.
4.1.3 Adjustable output voltage
The measurement of the transfer function H(f) in SFRA is independent of the output voltage level of the test instrument, as power transformer windings are considered linear systems. However, output voltage is directly linked to the signal-to-noise ratio. Increasing the output voltage level, especially at power frequency (50/60 Hz), can enhance immunity to narrowband power frequency noise.
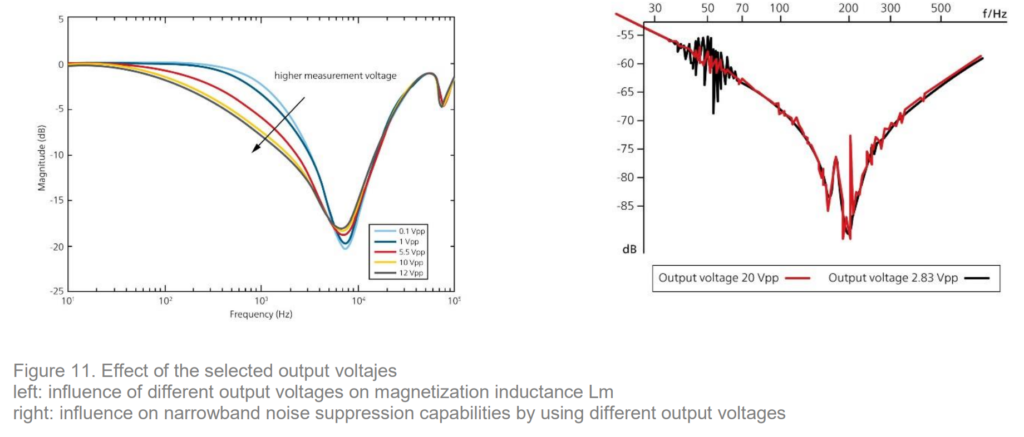
In the low-frequency range, the frequency response is primarily influenced by core magnetization inductance and depends on the applied voltage. This relationship is expressed in simplified formulas (4, 5, and 6).
In practice, the test voltage applied by SFRA equipment can alter the magnetic permeability (µ) following the hysteresis curve of the selected core material. This, in turn, affects the magnetic reluctance, subsequently altering the core inductance. Figure 11 illustrates the impact of different output voltages on SFRA plots and the increased immunity to narrowband noise associated with higher output voltage levels.
Software-based methods
Software-based methods for noise reduction in SFRA measurements primarily involve post-processing of data, including smoothing algorithms and averaging filters. These techniques aim to enhance the quality of SFRA traces by mitigating the impact of noise.
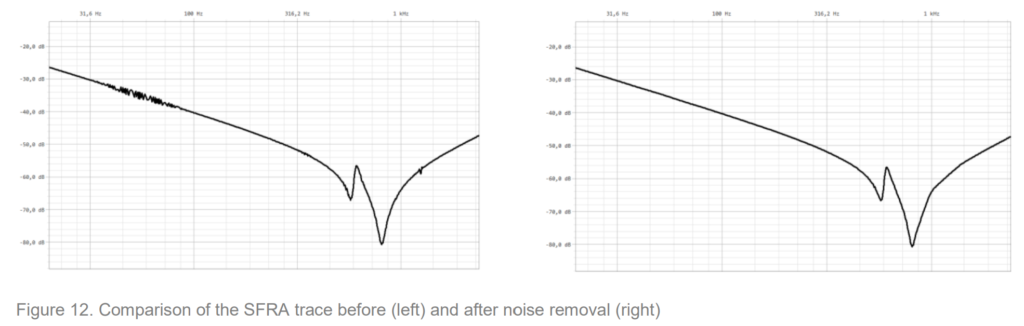
Filtering Techniques: Software-based methods encompass filtering techniques that remove noise from previously acquired SFRA traces through signal processing. Variance analysis is one approach, designed to identify and quantify non-linear distortions and disruptive noise within SFRA measurements. Additionally, methods like Wavelet transformation, typically used to suppress noise in time domain measurements, and Kalman filters can also be applied. Simple algorithms, including averaging filters, moving average filters, and exponential weighted moving average filters, are valuable tools for reconstructing distorted SFRA measurement traces. Some SFRA instruments include built-in signal processing tools in their basic software packages to enhance measurement data quality. Figure 12 illustrates the reconstruction of a distorted measurement trace caused by narrowband noise using an averaging filter.
Enhancing SFRA Trace Interpretation: Filter techniques contribute to improved interpretation of SFRA traces, particularly by SFRA experts. They enable the removal of resonances with ease, preventing potentially incorrect assessments of asset conditions. It’s important to note that the original measurement traces, without any signal processing, must also be retained for reference.
Case Study: SFRA Measurement on a 70 MVA Power Transformer
In this case study, a SFRA measurement was conducted on a three-phase 70 MVA power transformer with a primary winding rated at 240 kV and a secondary winding rated at 10.5 kVA. The primary objective of this SFRA measurement was to establish a reliable fingerprint for future diagnostic purposes, with a specific focus on assessing the transformer’s mechanical condition.
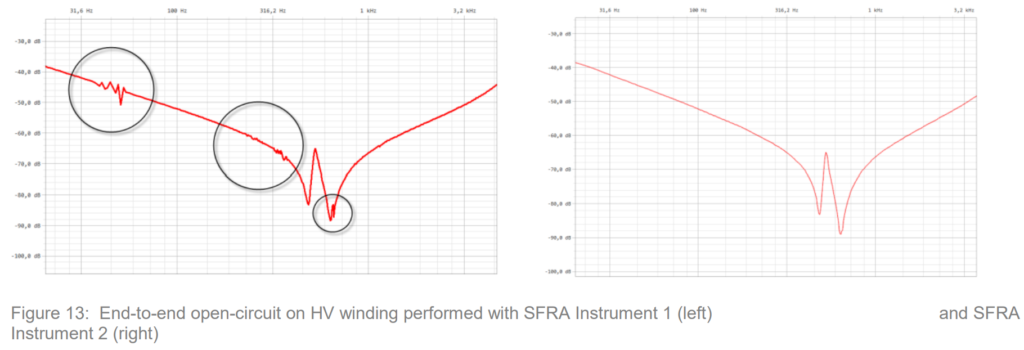
The SFRA measurement was carried out on-site, in proximity to an operational 240 kV overhead line. To evaluate the noise suppression capabilities of different SFRA instruments, two instruments with varying algorithms for receiver bandwidth adaptation were employed (Figure 13). As discussed in this article, both narrowband and broadband noise can impact multiple resonance points within the SFRA traces, potentially containing crucial asset-related information. This complexity can pose challenges, especially for users with limited experience.
The SFRA traces for phase U of the 240 kV winding reveal interesting insights. The SFRA trace obtained using SFRA Instrument 1 exhibited susceptibility to narrowband 50 Hz noise and its harmonics. Due to the fixed algorithms governing automatic bandwidth adaptation, the overall measurement duration (ranging from 20 Hz to 2 MHz) extended to 56 seconds. Additionally, the second resonance point, attributed to the parallel capacitance (Cg) and magnetization inductance (Lm), displayed slight distortion in the trace (left picture).
In contrast, the second measurement was conducted using a more advanced SFRA Instrument 2, equipped with enhanced hardware-based noise filtering capabilities. This instrument demonstrated intelligent bandwidth adaptation, resulting in measurement traces unaffected by external noise at low frequencies.
This case study highlights the importance of selecting appropriate SFRA instruments and their noise suppression capabilities, particularly when dealing with complex noise environments and critical measurements of power transformers.
Challenges in Capacitive Interwinding Measurements
Capacitive interwinding measurements can pose specific challenges related to noise interference, particularly due to the noise floor and power frequency noise, which can significantly impact the signal-to-noise ratio. To address these challenges and enhance measurement quality, several factors should be considered:
1. Dynamic Range: A higher dynamic range in SFRA instruments is advantageous as it allows for better differentiation between the desired signal and background noise. This is particularly relevant for capacitive interwinding measurements.
2. Output Voltage: Increasing the output voltage can contribute to improved interference immunity, especially at power frequencies (50/60 Hz). Higher output voltages help enhance the signal strength, making it less susceptible to noise.
3. Intelligent Receiver Bandwidth Adaptation: Employing intelligent receiver bandwidth adaptation is crucial for noise mitigation. This adaptive approach ensures that measurements are conducted with an optimal bandwidth, reducing susceptibility to noise at various frequencies.
The impact of these factors on capacitive interwinding measurements is evident in Figure 14. Results obtained using SFRA Instrument 1 exhibit significant distortion attributed to narrowband noise. In contrast, results from SFRA Instrument 2, which utilizes intelligent receiver bandwidth adaptation, demonstrate minimal distortion due to noise, leading to more accurate and reliable measurement outcomes.
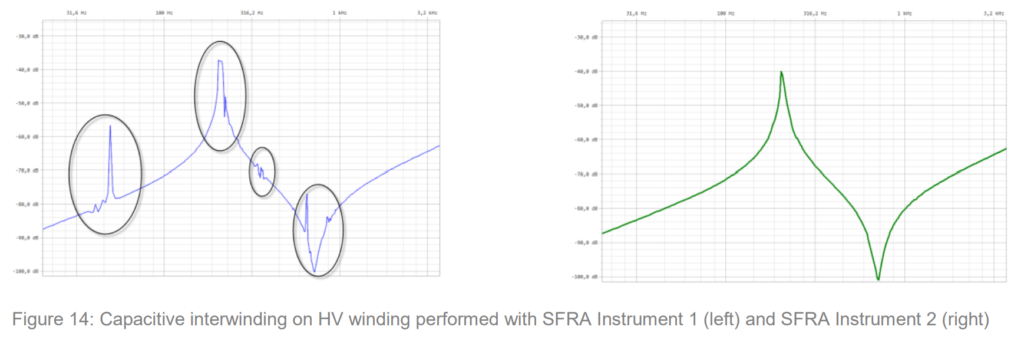
This comparison emphasizes the importance of selecting SFRA instruments with the right features and capabilities, particularly when conducting capacitive interwinding measurements in challenging noise environments.
Mitigating Narrowband Power Frequency Noise: End-to-End Short-Circuit Measurement
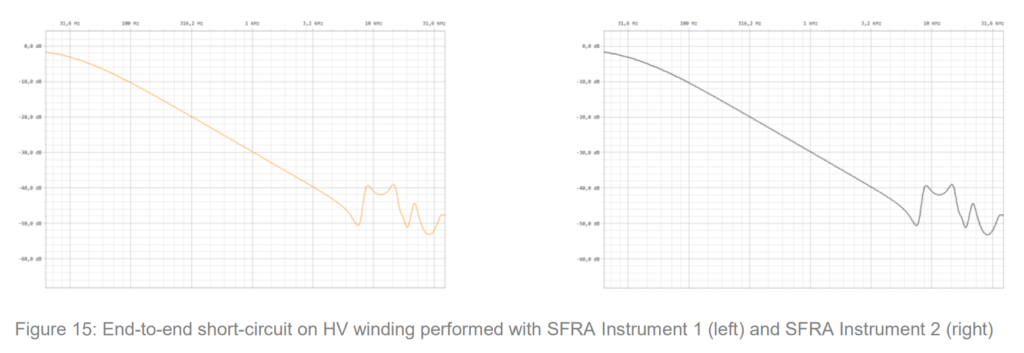
To counter the influence of narrowband power frequency noise, an alternative approach involves conducting an end-to-end short-circuit measurement, specifically by shortening the low-voltage side of the transformer. This method effectively isolates the winding impedance from core properties, particularly in the vicinity of the power frequency.
In essence, this approach deactivates the magnetization inductance (Lm) of the transformer, focusing solely on measuring the leakage reactance within the low-frequency range. It’s important to note that while this method effectively addresses noise issues, it comes with limitations. Specifically, it provides no information about the electrical condition of the transformer beyond noise mitigation. Therefore, it’s recommended to perform this method in addition to the standard end-to-end open-circuit measurement.
As depicted in Figure 15, the results of both measurement approaches demonstrate no distortions at the rated power frequency and its harmonics. This underscores the effectiveness of the end-to-end short-circuit measurement in minimizing the impact of narrowband power frequency noise on SFRA measurements.
In summary, the end-to-end short-circuit measurement is a valuable technique for noise reduction during SFRA assessments, particularly when dealing with narrowband power frequency noise. While it isolates the magnetization inductance and focuses on leakage reactance, it should be complemented with standard open-circuit measurements to obtain a comprehensive understanding of the transformer’s electrical condition.
Final Thoughts:
Noise originating from the environment within a substation can significantly impact the accuracy of Sweep Frequency Response Analysis (SFRA) measurements. This noise can be broadly categorized into narrowband and broadband noise, and addressing it effectively requires a combination of hardware-based techniques and software-based methods.
One critical factor in noise mitigation is the dynamic range of the testing device itself. To enhance the quality and reliability of SFRA traces, two primary techniques are commonly employed:
1. Adjustable Output Voltage: The output voltage level of the SFRA test instrument plays a crucial role in signal-to-noise ratio. By increasing the output voltage, particularly at power frequencies like 50/60 Hz, the interference immunity of narrowband power frequency noise can be improved.
2. Intelligent Receiver Bandwidth Adaption: Intelligent receiver bandwidth adaption is a hardware-based solution that adjusts the measurement bandwidth based on the signal’s characteristics. This technique is particularly effective at minimizing noise influences, especially at low frequencies. It ensures that only relevant signals within the desired bandwidth are considered, enhancing the reliability of the SFRA results.
In addition to hardware-based techniques, software-based methods offer flexibility in addressing noise-related challenges. These methods include:
– Smoothing Algorithms: These algorithms are used for post-processing data to reduce noise-induced distortions in SFRA traces. They can be applied after measurements to improve the quality of obtained results.
– Averaging Filters: Averaging filters help in reducing noise effects by smoothing out variations in the data. They are particularly useful for reconstructing distorted SFRA measurement traces.
It’s important to note that software-based solutions are independent of the testing device’s hardware and can be applied retrospectively for result assessment.
In cases where SFRA measurements exhibit distorted curves, individuals who may not be SFRA experts might find it challenging to assess the mechanical integrity of power transformers. However, by combining both hardware- and software-based techniques, the resulting SFRA traces can often be analyzed with minimal influence from noise.
The presented case studies highlight how low-frequency noise effects can be effectively reduced through intelligent receiver bandwidth adaption and increased output voltage. It’s essential to ensure that measurements in the low-frequency range are performed at the same output voltage used for the reference measurement to maintain proper reproducibility.
This article is sourced from ”IEC 60076-18”.